Range
Bars
Type
Scale
Grid
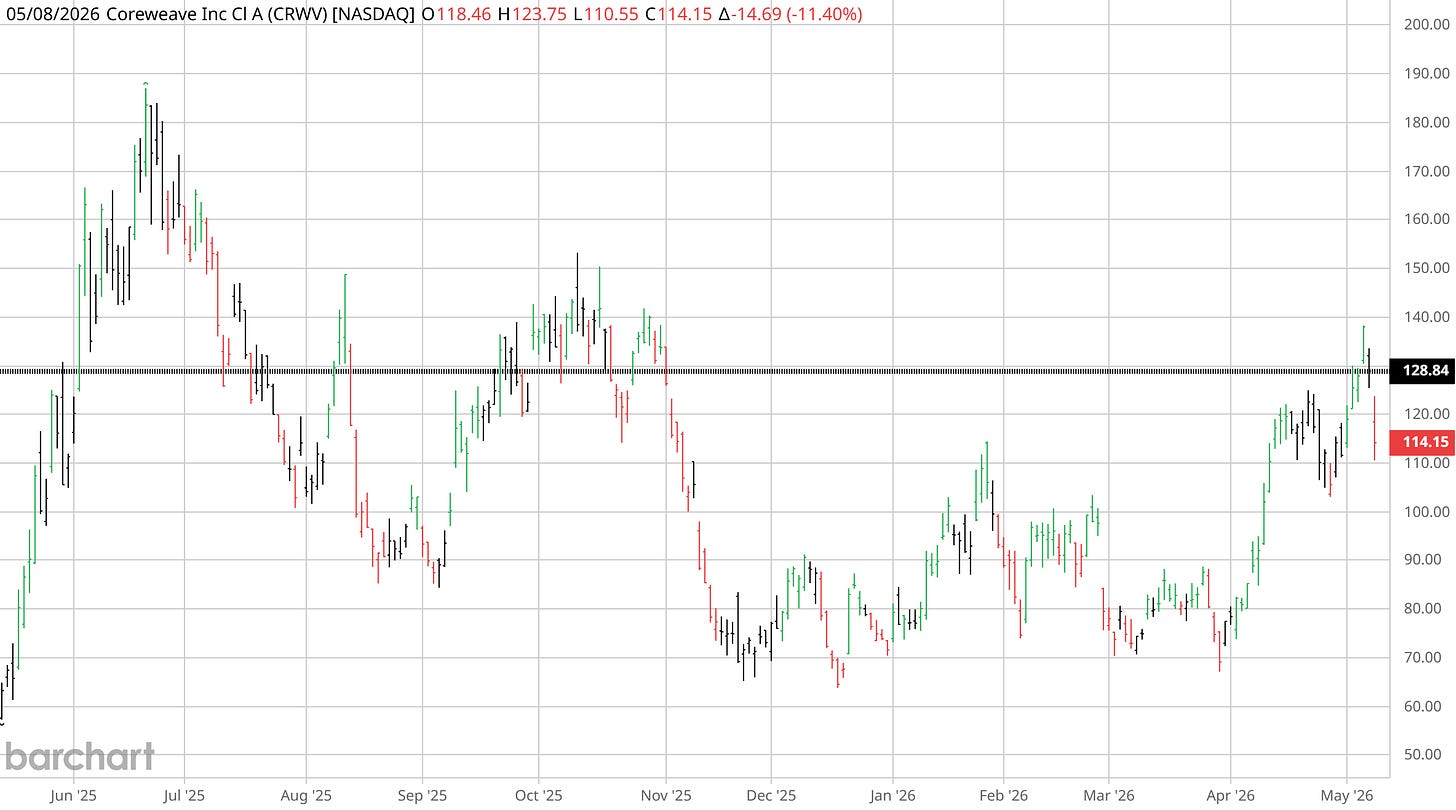
How to use this chart
Toolbar
- Range — 1M to MAX on daily closes. 1D/5D switch a US stock cell to 5-minute intraday bars; index and foreign cells fall back to 1M daily with a note.
- Grid — 1×1 up to 2×2. Cells are synchronized: pan or zoom one and the others follow the same dates; the crosshair tracks across all of them. 4 INDICES loads Rubin · HALO · AEI · AW40 side by side.
- Type / Scale — OHLC, line or area; linear or log price axis.
Picking a series
- Tap the box in a cell's header to browse every Closelooknet series — headline indices, sub-indices, sectors, layers of all five families — plus the constituents.
- Or type any ticker (NVDA, 7203.T, ASML.AS …) and press Enter — it charts in the cell straight from our data lake.
Studies
- Overlays / Oscillators rows toggle the standard set (SMA, Bollinger, RSI, MACD …) per cell.
- Levels (stock cells) draws the structure engine's support lines — regression bands, pivot cluster, SMA-200, the active fib zone.
Drawing
- Tap a tool (Trend, Ray, H-Line, Fib, Channel, Rect, Note), then tap the chart once per point — the shape follows your finger or cursor between taps. The chart stops panning while a tool is armed; tap the tool again to release.
- Drawings save per symbol in this browser and travel between the terminal and the asset page.
- Delete key removes the selected drawing · Escape cancels a half-placed one · Clear wipes the symbol.
Wave counts
- Wave places an Elliott count: tap the origin, then each wave end. Press Enter to stop early (inside wave 3 is fine) — dotted ghost targets sketch the remaining waves at guideline ratios.
- On stocks the scanner's machine count appears automatically in grey — it is fully editable: drag any point, double-tap a label to remove it, Delete to dismiss it for good, Adopt to bring the machine's proposal back.
- The sequence picker switches 1-5 / A-B-C / A-E / W-X-Y-Z; 1 2 3 cycles the degree; Subdiv starts a one-degree-smaller child count inside a wave.
Sharing
- Card exports the cell as a branded PNG — chart, drawings and levels exactly as shown.
Side by side:
The names in the chart grid, compared column by column. Change a chart cell and the table follows.
Prices from the Closelooknet data lake; valuation and margins from the vendor fundamentals; money-flow from our Directional Flow scan. A dash means no data for that name. A comparison, not a recommendation.
Key statistics fundamentals · refreshed daily
Financial summary annual statements
Closelooknet ETF read our dispersion engine · constituent internals · methodology →
Ratios & established scores literature-standard · percentile vs the Closelooknet index universe
Closelooknet company score our methodology · versioned weights · how this score works →
52-Week Range
Technical read
Relative strength the name ÷ benchmark · 1Y = 100 · scroll to zoom, drag to pan
Asymmetric risk & beta stability up/down beta vs SPY
Analyst view FMP consensus · US large-cap
Structure & regime pattern scanner · nightly
Directional Flow daily scan · flow & deltas
Closelooknet portfolio activity trade log · research diary
Earnings Earnings Wire · US calendar
Earnings-call read key quotes · earnings-NLP
Index Membership
Index internals
ETF context weight · RS rank · 21d vs fund
Money Temperature 5-dimension read
Term-structure read SHY 1-3y · IEF 7-10y · TLT 20y+
Predictions
Continue exploring
Pick a ticker to load its detail page.
Stock Detail
Per-ticker OHLC, SMA, performance.
Search any ticker in the box above, pick a popular name below, or browse a Closelooknet index. Charts render from the Data Lake for Rubin 100 names and fall back to the source indices for HALO / Euro-AI / AW25.
Popular