Lab · Pattern Methodology
Pattern Lab.
Methodology home for every formalized pattern in the Closelooknet Pattern Engine. Each pattern starts here as a Lab Read with its academic foundation, lands in the Engine as live signals, and carries a methodology summary that connects the two.
The dual structure
Closelooknet organizes pattern research as a deliberate split: Lab explains the why; Engine shows you the now. Lab pages document the academic foundation, the failure modes, the worked historical examples — the full theory. Engine pages publish the live signals, updated every Friday after the US close. Each pattern carries a methodology summary on the Lab side and a live signal table on the Engine side, with both linking back to the long-form Lab Read in the Reports section.
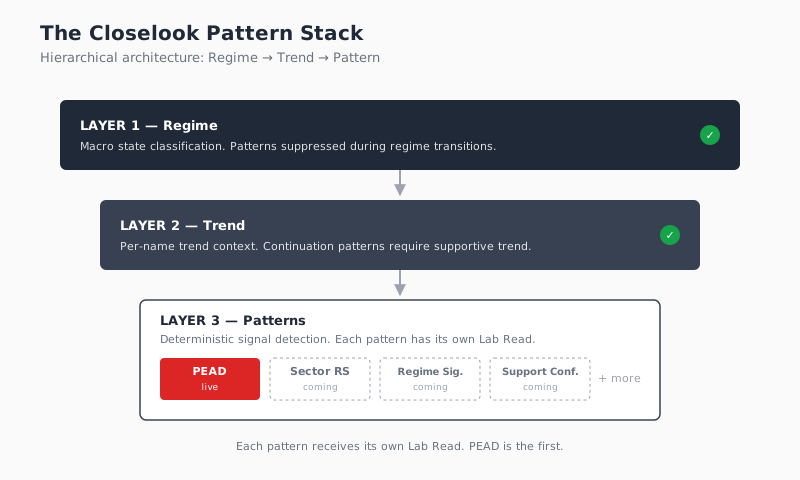
The architecture is hierarchical by design. Regime sits at the top: every pattern below operates against an explicit regime classification, and most are suppressed during regime transitions. Trend sits in the middle: the trend context for each name is established before any pattern signal is allowed to fire. Pattern signals like PEAD sit at the third layer: deterministic, mechanical, designed to combine with the upstream context to produce candidate signals — never standalone trade recommendations.
Pattern roster
-
The 60-year market anomaly that survives. 3-day cumulative abnormal return classification with 63-day holding window.
-
NVIDIA’s corporate equity deployments as a leading indicator for the Rubin Build-Out rotation. Four-tier signal hierarchy, 16-event timeline 2023-07-12 → 2026-05-12, live 10-name cohort, forward calendar of Tier 1/2/3 events.
-
Rotational rankings of the eleven SPDR sectors against SPY — RS-ratio, 21/63/252-day outperformance, Z-score mean-reversion, and JdK-style RRG quadrant. Refreshed daily.
-
Regime Signature
LiveGrind-Up vs Drift-Down quadrant classifier for SPY + 11 SPDRs. Slope × realised vol; encodes when continuation patterns work and when they don't.
-
Deterministic identification of high-probability support clusters from log-regression-channel boundaries. Four horizons (63/126/252/504 bars), bands at ±2σ, cluster threshold 2%.
-
Rolling Engle-Granger + Hurst + Halflife (Ornstein-Uhlenbeck) + Cross-Correlation Function — applied to BTC/Gold (substitution thesis) and BTC/NDX (lead-lag thesis), plus a 2x2 Macro-Quadrant joint reading.
See the patterns live
The Pattern Engine publishes its weekly output every Friday after the US close. PEAD signals are tagged distinctly with their CAR magnitude, regime context, trend status, the universe scanned, and the expected 63-day hold horizon.
FAQ · from the current data
Quick answers
What is the Pattern Lab?
The Pattern Lab is the methodology home for every formalized pattern in the Closelooknet Pattern Engine. Each pattern documents its rule and construction here, publishes live signal output in the Pattern Engine, and carries a full-length dossier in Reports.
How does a pattern move from Lab to live signals?
Every pattern follows the same three-part structure: the Lab page (here) explains the rule and methodology, the Pattern Engine publishes live signal output updated after each US close, and the Reports section carries the long-form dossier with worked historical examples. All three cross-link to each other.
How many patterns are documented in the Pattern Lab, and which are live?
6 patterns are documented: PEAD, Pattern 03, Sector Relative Strength, Regime Signature, Support Confluence, Cointegration as Regime. 6 of 6 are currently live.