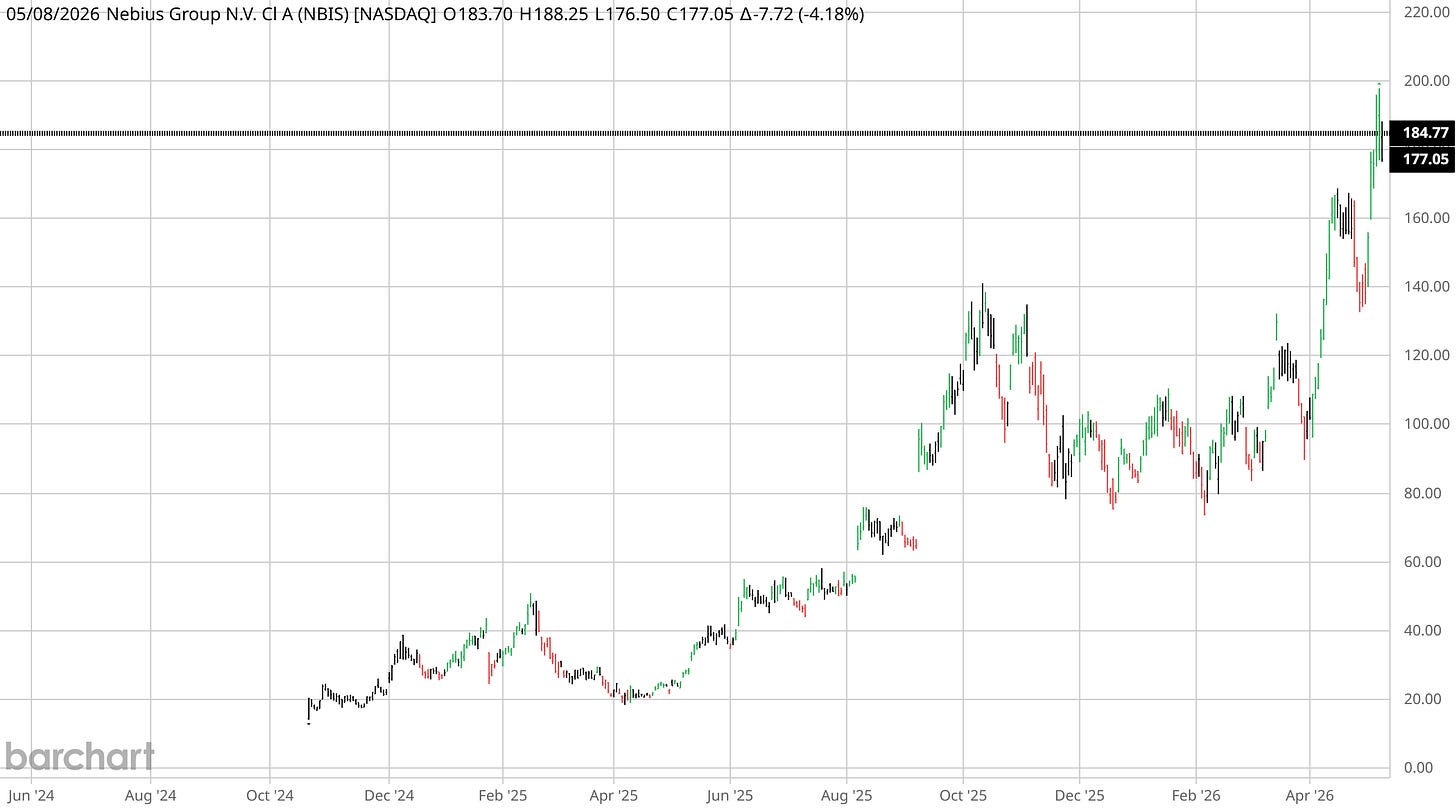
—

Nebius Group N.V. (NBIS) — chart, structure and Closelooknet read

Pick a ticker to load its detail page.

The desk on NBIS

What this diary said about Nebius Group N.V., what it holds and what would change its view — in its own words, dated. Investment diary, not advice.

What we said

What we hold

BookPositionSinceResult
Global Tech 50 100 shares · average entry $89.96 — +177.8%
AI Buildout 75 shares · average entry $98.02 — +154.9%
Hypergrowth 200 shares · average entry $126.56 — +97.4%
Hypergrowth short 2 calls · $250 strike · 21 Jan 2028 · sold at $91.31, now $97.72 — −7.0%
Derivatives short 1 put · $160 strike · 17 Jun 2027 · sold at $34.44, now $18.95 27 May 2026 +45.0%
AI Cycle 2030 (wikifolio) ↗ 12 shares · average entry €156.66 — —

Model books as of 6 Oct 2026; wikifolio positions from the official wikifolio data, entries in euros. Results are unrealised, before any exit. A record of what the diary does, not a recommendation to do the same.

Our record on NBIS

Every scored call, pick and trade this diary has made on Nebius Group N.V., with the outcome where it is known.

Charts from the desk on NBIS

The charts this diary drew or picked on Nebius Group N.V., as published — each dated and linked to the piece that explains it.

Signals for this name

Every Closelooknet reading that exists for NBIS, from the same nightly bakes the boards use. Research diary readings, not advice.

Versus its index Agentic Ecosystem Index · Euro-AI 50 — the name, its sleeve and the index over day, week and month

Versus its index

The name against its Closelooknet index and its own sleeve — equal-weight, nightly closes.

Agentic Ecosystem Index · as of 2026-10-06

DayWeekMonth3 months
NBIS+7.4%+5.3%+10.4%+15.4%
Compute Operators+2.2%+2.7%+0.4%—
Agentic Ecosystem Index+1.2%+4.8%+14.4%—

Against the index: 0.5 pts ahead on the week, 4.0 pts behind on the month; against its Compute Operators sleeve 10.0 pts ahead on the month.

Euro-AI 50 · as of 2026-10-06

DayWeekMonth3 months
NBIS+7.4%+5.3%+10.4%+15.4%
Euro-AI 50+0.1%+2.4%+2.1%—

Against the index: 2.9 pts ahead on the week, 8.3 pts ahead on the month.

Returns from the index workers’ nightly closes; equal-weight sleeves. A relative reading from the research diary, not advice.

Mentioned on Closelooknet 21 pieces · newest: Midday 10, “AI Credit — Oracle invokes force majeure on a New Mexico data center; the 30-year hits 5.45%” (2026-09-24)

Mentioned on Closelooknet

Where NBIS appears in the diary — 21 pieces, newest first. Every link is our own writing.

Long reads

101 and glossary

Dailies

Weather around the name 3 macro readings: Money Temperature, Factor regime, Sovereign pressure

The weather around this name

Macro readings that apply by membership — the regime, the factor tape, the sector cell, the funding backdrop.

  • Money Temperature Composite 61/100 · S&P 500 fund at 75, bullish alignedEight instruments scored on position, momentum, volume, volatility and fragility — the regime every name trades inside. Temperature lab → 2026-10-06
  • Factor regime Momentum leading — risk appetite buildingMomentum against low volatility (SPMO / SPLV): above its 50-day trend, 98th percentile of the window, +5.7% over 20 sessions. Factor regime → 2026-10-06
  • Sovereign pressure Index 0.74 · up 0.17 over 21 sessionsG7 long-end yields, 10s30s and the slope — the funding weather for every balance sheet on this site. Sovereign pressure → 2026-10-06
How it trades on rate days beta 0.18 to TLT · on the worst bond days it held up better than the market

How it trades on rate days

How NBIS has moved when long-dated Treasury yields rise — measured against TLT, the 20+ year Treasury fund.

  • Beta to long bonds, 1 year 0.18 — shows only a loose link to bond moves for every 1% move in TLT (20+ year Treasuries), Nebius Group N.V. moved 0.18% on average · correlation 0.02 · higher than 19% of US names
  • Beta, last 3 months 1.42 more rate-sensitive lately than over the year
  • On the 10 worst bond days +0.07% on average against −0.74% for the S&P 500 the 10 sessions of the past year in which TLT fell most, i.e. long yields rose most
  • Latest of those days +7.44% TLT −1.29% that day 2026-09-24

Daily total returns from the adjusted price series; a TLT down day is a day long yields rose. Beta = the average move of the name for a 1% move in TLT. Past sensitivity, not a forecast. An investment diary, not a recommendation.

Who it is priced against Neoclouds and GPU renters · 4 names with week and year-to-date

Peer group

Neoclouds and GPU renters

Curated competitor set — who the market prices this name against, not just who shares its sector.

Compared against NBIS on the nightly bakes; the Peers tab ranks the cohort on the Closelooknet scores where it exists.

Company snapshot — Nebius Group N.V.

NBIS in five paragraphs: what it makes and sells, where it sits in the Closelooknet stack, who it is priced against, why we track it, what we watch. Research diary, not advice.

What it does
Nebius builds infrastructure for AI workloads, running large GPU clusters and a cloud platform with developer tools for training and deploying models. It also owns TripleTen, an education service for technology careers, and Avride, which works on self-driving cars and delivery robots. The company has a partnership with Nvidia to expand its AI cloud capacity, and is based in the Netherlands after a rename from its former identity.
Where it sits in the stack
Nebius carries no seat in our Rubin index, so it sits in the diary's neocloud and GPU-rental sleeve, alongside firms that rent out AI compute rather than design or fabricate chips. Inside that sleeve it is a customer of the chip and equipment layers, buying GPUs to resell as cloud capacity to model builders.
Who it is priced against
Closelooknet's peer group for Nebius is neoclouds and GPU renters, the firms the market prices it against rather than plain sector peers: CoreWeave, IREN, Oracle and Applied Digital. A wider comparison the market draws is with the large cloud providers such as Microsoft Azure.
Why Closelooknet tracks it
Nebius holds a seat in our Euro-AI 50 index and carries a Closelooknet score, with momentum its strongest module and quality its weakest. The diary has quoted it across a Dossier on orchestration infrastructure, a Heresy piece on portfolio construction, and a Report tracking Nvidia-linked investment patterns.
What the diary watches
Whether the quality module improves as earnings consistency builds, given a mixed record of beats and misses noted in the diary's readings on the name.

Nebius Group N.V. (NBIS) trades on US exchanges, classified under Communication Services. Constituent of Euro-AI 50.

The Closelooknet company score reads 47/100 composite (momentum 83, quality 19, valuation 23) across 7 modules — the full breakdown, chart structure and analog history load live above.

Written from the company’s public profile and Closelooknet’s own readings, 2026-09-17. Descriptive, refreshed with the registry; corrections welcome via the imprint. closelook.net is an investment research diary — market structure, index membership and scores are our own readings, not investment advice. Related: index compare · sector dispersion · scanner.

The Street on this name 5 analyst actions on the wire · latest: initiation by William Blair, 2026-09-30

The Street on this name

Analyst actions and the latest print for NBIS from the Closelooknet wires — third-party opinions on the record, not our readings.

  • Initiation William Blair — at Outperform Initiated to Outperform 2026-09-30
  • Price target BNP Paribas — target 399 Target set to $399 (+76.1% to spot) 2026-09-24
  • Price target BTG Pactual — target 223 Target set to $223 (-4.4% to spot) 2026-09-21

5 actions on the analyst wire since 2026-08-13: 1 initiation, 4 target changes. Analyst wire → · Earnings wire →

Dividends and capital return no distribution in twelve months

Dividends and capital return

What NBIS pays out and buys back — distributions read from the price series, money terms from the filings.

  • Distributions No cash distribution recorded in the price series over the last three years
  • Share count −9.9% in FY2025 83 m USD of stock-based compensation in the year

Per-share amounts are derived from the adjusted price series in the listing currency, so dates sit within days of the ex-date; filing figures come from the fundamentals feed for the last reported fiscal year. An investment diary, not a recommendation.

FAQ · from the current data · as of 2026-10-07

Quick answers

What is Nebius Group N.V. (NBIS)?

Nebius Group N.V. trades as NBIS on the US exchange and is classified under Communication Services in the Closelooknet research universe, as of the registry build of 2026-10-07.

Is NBIS in a Closelooknet index?

Yes — Nebius Group N.V. is a constituent of Euro-AI 50, as of 2026-10-07.

What is Nebius Group N.V.'s Closelooknet composite score?

47 out of 100, with momentum 83, quality 19 and valuation 23 sub-scores, as of 2026-10-07. Scores are Closelooknet's own research readings, not ratings or investment advice.

What is Nebius Group N.V.'s earnings print record?

Across the 8 prints Closelooknet covers, Nebius Group N.V. beat EPS estimates 5 times and revenue estimates 3 times; the three-day reactions split 3 up, 1 flat and 4 down (moves beyond ±3%), as of the 2026-08-11 card. The full print-record card carries the per-print history.

Where does NBIS trade against its moving averages?

Down 4.2% at the close: one of the day's sharpest drops. As of 2026-10-05 — a technical state from the nightly Closelooknet bake, not advice. The Technical tab carries the full row.

How is NBIS doing against its Closelooknet index?

Over the past month Nebius Group N.V. is +10.4% against +14.4% for the Agentic Ecosystem Index — 4.0 points behind its index, as of 2026-10-06. Its Compute Operators sleeve is +0.4% over the same month. The “Versus its index” table on this page carries the day, the week and the month for the name, its sleeve and the index.

How does Nebius Group N.V. compare with its peers?

Against its peer group (Neoclouds and GPU renters), Nebius Group N.V. (NBIS) sits 22.4% below its 52-week high, 5.8% above its 50-day average; CoreWeave, Inc. Class A Common Stock (CRWV) is 40.4% below, IREN Ltd (IREN) is 47.3% below, Oracle Corporation (ORCL) is 58.2% below. Put any of them next to NBIS in the chart grid (2×1 or 2×2) and the page lays the companies side by side: performance, trend, valuation, margins and our money-flow reading.

How does Nebius Group N.V. trade when bond yields rise?

Over the past year Nebius Group N.V. had a beta of 0.18 to TLT, the long-dated Treasury fund — it shows only a loose link to bond moves, higher than 19% of US names. On the 10 sessions in which long bonds fell most it moved +0.07% on average, against −0.74% for the S&P 500. The "How it trades on rate days" block on this page carries the lines.

Where has Closelooknet written about Nebius Group N.V.?

Nebius Group N.V. appears in 21 Closelooknet pieces, most recently Midday 10: AI Credit — Oracle invokes force majeure on a New Mexico data center; the 30-year hits 5.45% (2026-09-24); Daily Pulse: Hypergrowth — Nebius Bought Back $13 Cheaper and Four Calls Sold Over the Book (2026-09-19); Morning 10: Oil settles at $107.63, the 10-year hits 4.95% and the 30-year 5.36%, its highest since 2007: chips lead a fourth down day, Oracle beats and jumps 4% after hours, Adobe beats and slips — and Asia sells its chipmakers 3% to 7% (2026-09-11). What Closelooknet said most recently: Private-credit lenders lower but calm: OBDC (-1.6%), Ares Capital (-0.91%), BXSL (-0.73%); the neoclouds mixed: Applied Digital (-2.53%), TeraWulf (-2.11%), Core Scientific (-1.57%), CoreWeave (-0.93%), Nebius $239.80 (+5.82%) (Midday 10, 2026-09-24). The "Mentioned on Closelooknet" block on this page lists the long reads, the reference entries and the dailies that name it.

Does Closelooknet hold Nebius Group N.V.?

Yes — Global Tech 50: 100 shares · average entry $89.96, +177.8% unrealised; AI Buildout: 75 shares · average entry $98.02, +154.9% unrealised; Hypergrowth: 200 shares · average entry $126.56, +97.4% unrealised; Hypergrowth: short 2 calls · $250 strike · 21 Jan 2028 · sold at $91.31, now $97.72, -7.0% unrealised; Derivatives: short 1 put · $160 strike · 17 Jun 2027 · sold at $34.44, now $18.95 since 2026-05-27, +45.0% unrealised; AI Cycle 2030 (wikifolio): 12 shares · average entry €156.66. A record of what the diary does, not a recommendation to do the same.

What does Nebius Group N.V. do?

Nebius builds infrastructure for AI workloads, running large GPU clusters and a cloud platform with developer tools for training and deploying models. It also owns TripleTen, an education service for technology careers, and Avride, which works on self-driving cars and delivery robots. The company has a partnership with Nvidia to expand its AI cloud capacity, and is based in the Netherlands after a rename from its former identity. Closelooknet's peer group for Nebius is neoclouds and GPU renters, the firms the market prices it against rather than plain sector peers: CoreWeave, IREN, Oracle and Applied Digital. A wider comparison the market draws is with the large cloud providers such as Microsoft Azure.

Where does Nebius Group N.V. sit in the AI build-out?

Nebius carries no seat in our Rubin index, so it sits in the diary's neocloud and GPU-rental sleeve, alongside firms that rent out AI compute rather than design or fabricate chips. Inside that sleeve it is a customer of the chip and equipment layers, buying GPUs to resell as cloud capacity to model builders. Nebius holds a seat in our Euro-AI 50 index and carries a Closelooknet score, with momentum its strongest module and quality its weakest. The diary has quoted it across a Dossier on orchestration infrastructure, a Heresy piece on portfolio construction, and a Report tracking Nvidia-linked investment patterns.

Does Nebius Group N.V. pay a dividend?

No cash distribution shows in Nebius Group N.V.’s price series over the last three years. The share count fell 9.9% over the fiscal year. The "Dividends and capital return" block on this page carries the lines.

What has Wall Street done on Nebius Group N.V. recently?

The most recent analyst action on Nebius Group N.V. on the Closelooknet wire is a initiation by William Blair on 2026-09-30 (at Outperform). 5 actions on the analyst wire since 2026-08-13: 1 initiation, 4 target changes. Analyst actions are third-party opinions recorded by the wire, not Closelooknet readings. The “The Street on this name” block on this page lists the moves; the full feeds are the analyst wire and the earnings wire.

What does this page show?

A live price chart with SMA overlays and drawing tools for NBIS, performance metrics, index-membership context and the Closelooknet structure read — an investment research diary view, not investment advice.

Related in the Closelooknet universe

same Closelooknet index seat first, then Internet Content & Information. Scored names rank on their Closelooknet score; names without one rank on trend state — above or below their 50- and 200-day averages — never on a score they do not carry.