Source page — copy text into Substack/LinkedIn, upload the visuals. noindex · not public

Closelook@US Stock Markets · Weekly Edition
Nasdaq — The Confirmation Came, and the Market Underneath Made Its Low
The Nasdaq 100 fund closed the week at 749.58, a record and above the 746.16 line this letter has waited on since August — the confirmation, on a weekly close. On the same Friday the Nasdaq 100 without its tech stocks closed at its lowest level of the year, the S&P 500 without tech fell 1.5%, only three of eleven sectors rose, and not one financial stock in the S&P closed above its 20-day average. Soft inflation and a weak jobs report could not lower the long end. The fourth quarter starts here — the strongest stretch of the calendar, two uncertain weeks before the reporting season, and TSMC's September sales as the first test.
Closelooknet is a reader-supported publication — to receive new posts and support the work, become a free or paid subscriber.
1 · This Week's Action
The confirmation came. The Nasdaq 100 fund closed Friday at 749.58 — up 0.68% on the week, a record close, and above 746.16, the line this letter set in August as the confirmation of the advance. Last week it closed through the line once, on Tuesday, and finished the week under it. This week it finished above it. The index itself closed at 30,916, +1.01%, a record. The path: 736.53 Monday (−1.07%), 737.93, 739.77, 742.03, 749.58 (+1.02% on Friday) — four up days after a down Monday, the last of them on a jobs report that showed almost no jobs.
And the market underneath made its low. On the same Friday the Nasdaq 100 without its tech stocks closed at 95.89, −1.06% on the week — its lowest close of 2026, under last week's 95.94. The S&P 500 without tech fell 1.48%. The S&P 500 fund slipped 0.22% to 769.64, 1.1% under its August high; the equal-weight S&P fell 0.65% and sits 3.2% under its 50-day average; the small caps fell 0.16%. The two halves of the market moved in opposite directions on the same five days, and the index that measures the largest companies recorded only the half that went up.
| Symbol | Name | Last | 5D | 1M | 3M | 6M | YTD |
|---|---|---|---|---|---|---|---|
| UUP | Invesco DB US Dollar Index Bul | 28.89 | +0.94% | +2.56% | +1.94% | +3.70% | +6.88% |
| QTOP | iShares Nasdaq Top 30 Stocks | 39.78 | +0.90% | +7.75% | +6.95% | +30.78% | +24.48% |
| QQQ | Invesco QQQ | 749.58 | +0.68% | +5.69% | +5.19% | +28.14% | +22.02% |
| IBIT | iShares Bitcoin | 47.73 | +0.34% | +9.00% | +36.88% | +25.70% | -3.87% |
| SPY | S&P 500 | 769.64 | -0.22% | +0.59% | +3.34% | +17.35% | +12.86% |
| TOPT | iShares Top 20 U.S. Stocks | 35.21 | -0.37% | +4.26% | +7.74% | +22.05% | +12.74% |
| USO | United States Oil LP | 147.37 | -0.65% | +4.41% | +41.73% | +6.85% | +113.09% |
| COPX | Global X - Copper Miners | 85.91 | -0.95% | -4.44% | +12.08% | +11.77% | +19.67% |
| IEF | iShares 7-10 Year Treasury Bon | 89.05 | -1.06% | -3.40% | -5.39% | -6.52% | -7.39% |
| TLT | iShares 20+ Year Treasury Bond | 77.48 | -2.32% | -5.45% | -9.39% | -10.73% | -11.11% |
| GLD | Gold Shares | 380.14 | -3.37% | -5.62% | +0.53% | -11.47% | -4.08% |
| SLV | iShares Silver | 54.74 | -5.85% | -7.33% | -0.51% | -16.80% | -15.03% |
Sorted by Weighted Alpha (leaders → laggards) · Barchart, close of week.
The cross-asset tape — four of twelve green. The dollar fund +0.94%, the Nasdaq top-30 fund +0.90%, the Nasdaq 100 +0.68%, the bitcoin fund +0.34%. Everything else fell: silver −5.85%, gold −3.37%, the long bond −2.32%, the belly −1.06%, copper miners −0.95%, oil −0.65%, the US top-20 fund −0.37%, the S&P −0.22%. The dollar fund made its highest close of the year on Thursday. The market bought the currency and the thirty largest Nasdaq stocks and sold everything that pays a fixed rate or stores value.
The eleven S&P 500 sectors
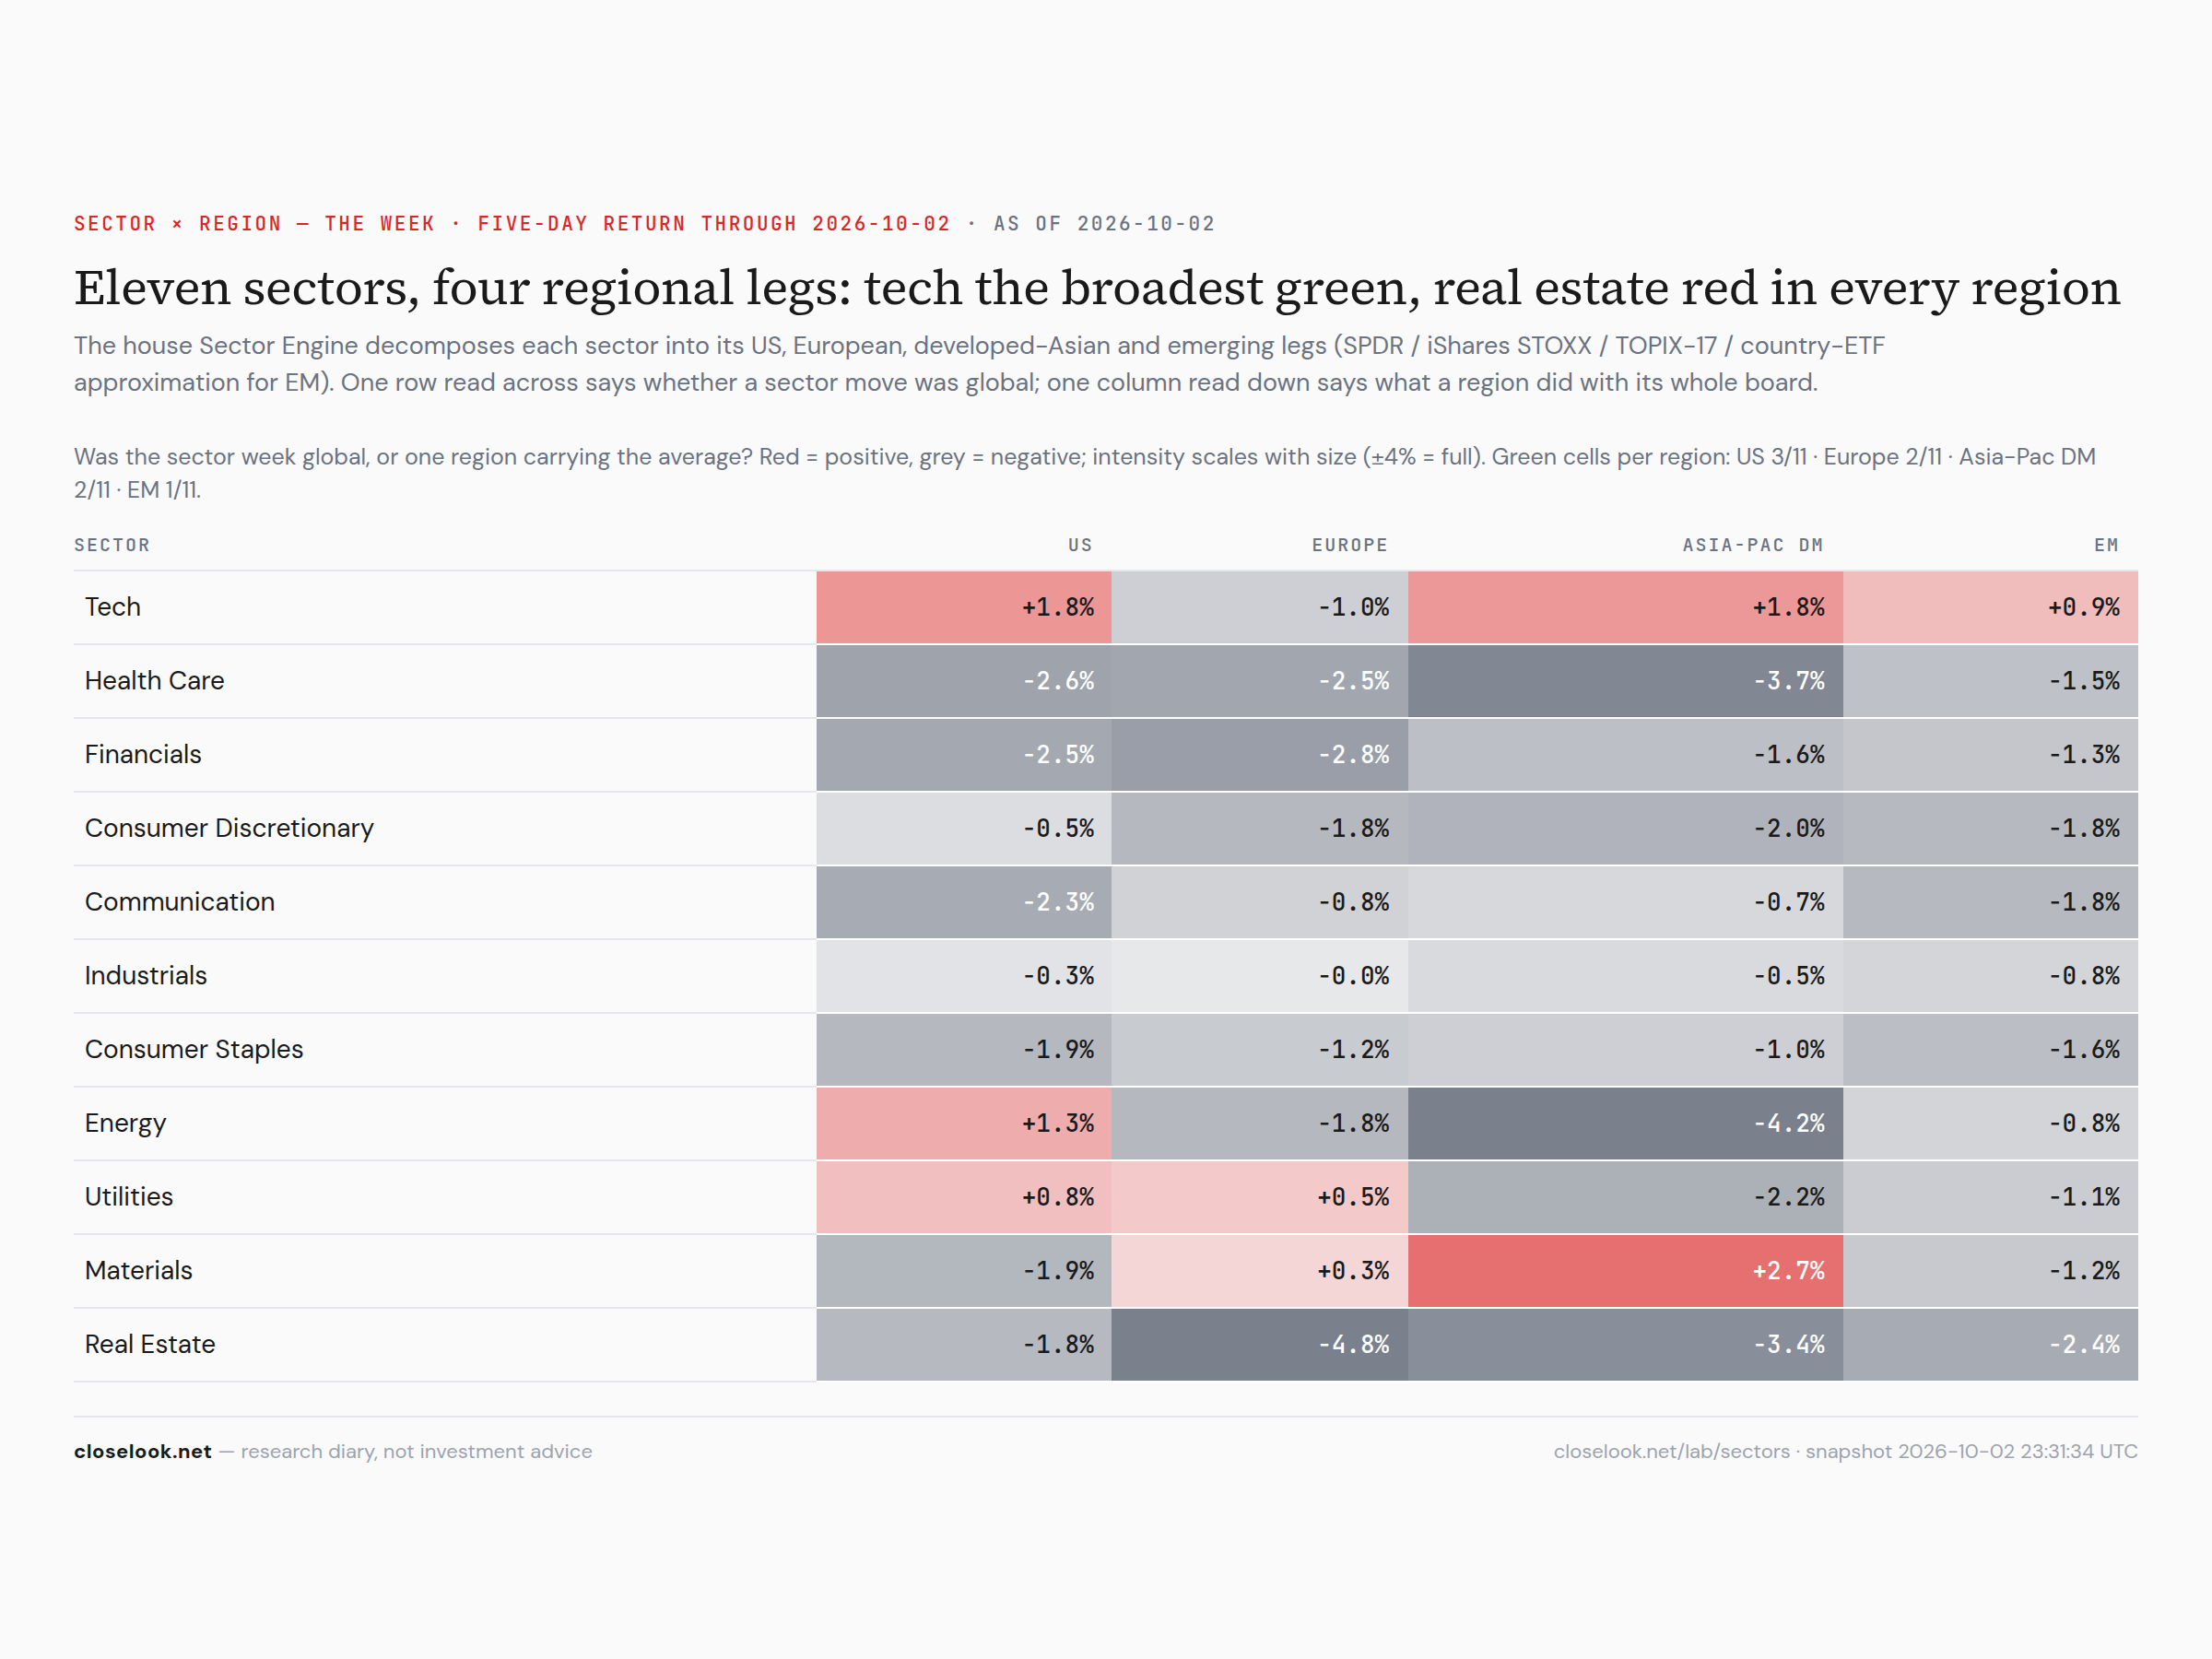
Three of eleven green. Technology +1.80% to a record 199.81, energy +1.26%, utilities +0.81%. The bottom: health care −2.65%, financials −2.46%, communications −2.34%, materials −1.89%, staples −1.86%, real estate −1.80%, discretionary −0.47%, industrials −0.28%.
| Symbol | Name | Last | 5D | 1M | 3M | 6M | YTD |
|---|---|---|---|---|---|---|---|
| XLK | Technology | 199.81 | +1.80% | +8.83% | +10.64% | +46.93% | +38.79% |
| XLE | Energy | 62.82 | +1.26% | -3.50% | +18.04% | +6.03% | +40.51% |
| XLU | Utilities | 39.83 | +0.81% | -6.66% | -12.96% | -14.05% | -6.70% |
| XLI | Industrial | 169.95 | -0.28% | -1.64% | -7.59% | +3.77% | +9.56% |
| XLY | Consumer Discretionary | 110.04 | -0.47% | -4.20% | -6.05% | +1.75% | -7.85% |
| XLRE | Real Estate | 40.81 | -1.80% | -6.68% | -8.66% | -1.92% | +1.14% |
| XLP | Consumer Staples | 80.53 | -1.86% | -5.85% | -5.25% | -1.66% | +3.67% |
| XLB | Materials | 48.86 | -1.89% | -7.72% | -6.06% | -3.07% | +7.74% |
| XLC | Communication Services | 110.32 | -2.34% | -1.87% | +0.66% | -1.24% | -6.29% |
| XLF | Financial | 53.49 | -2.46% | -7.23% | -3.83% | +8.00% | -2.34% |
| XLV | Health Care | 166.18 | -2.65% | -3.91% | +1.49% | +13.19% | +7.35% |
Sorted by Weighted Alpha (leaders → laggards) · Barchart, close of week.
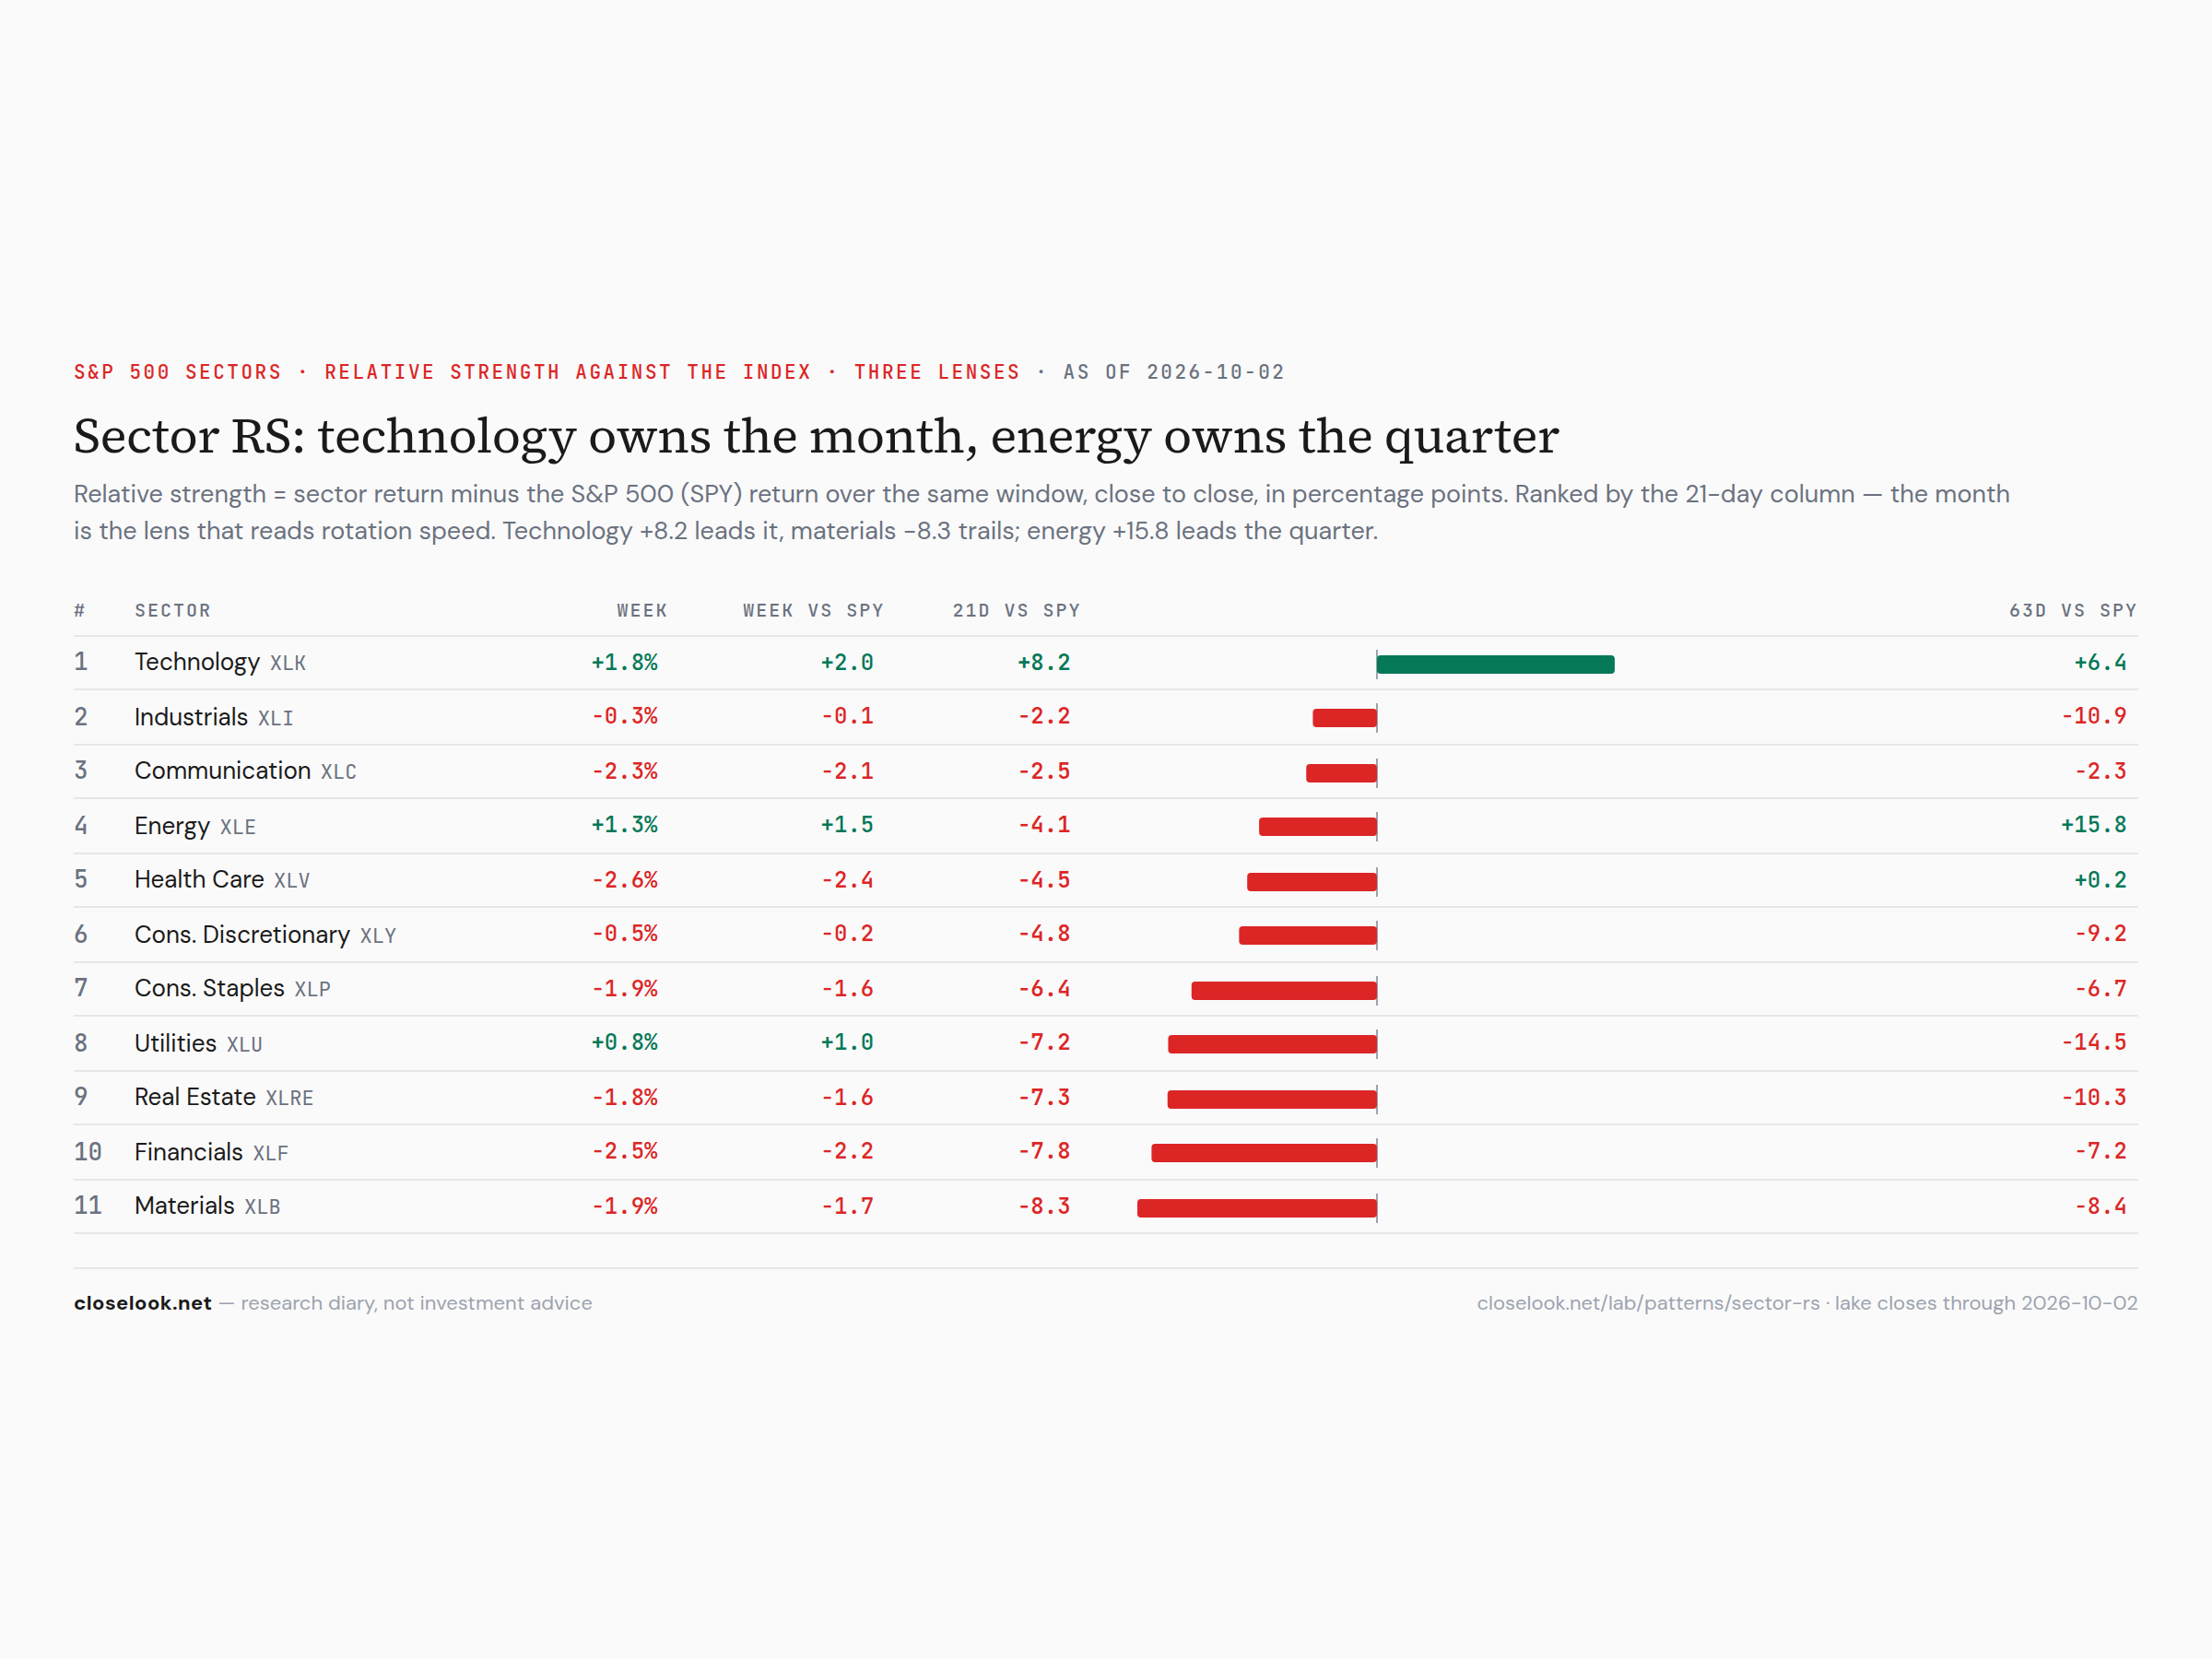
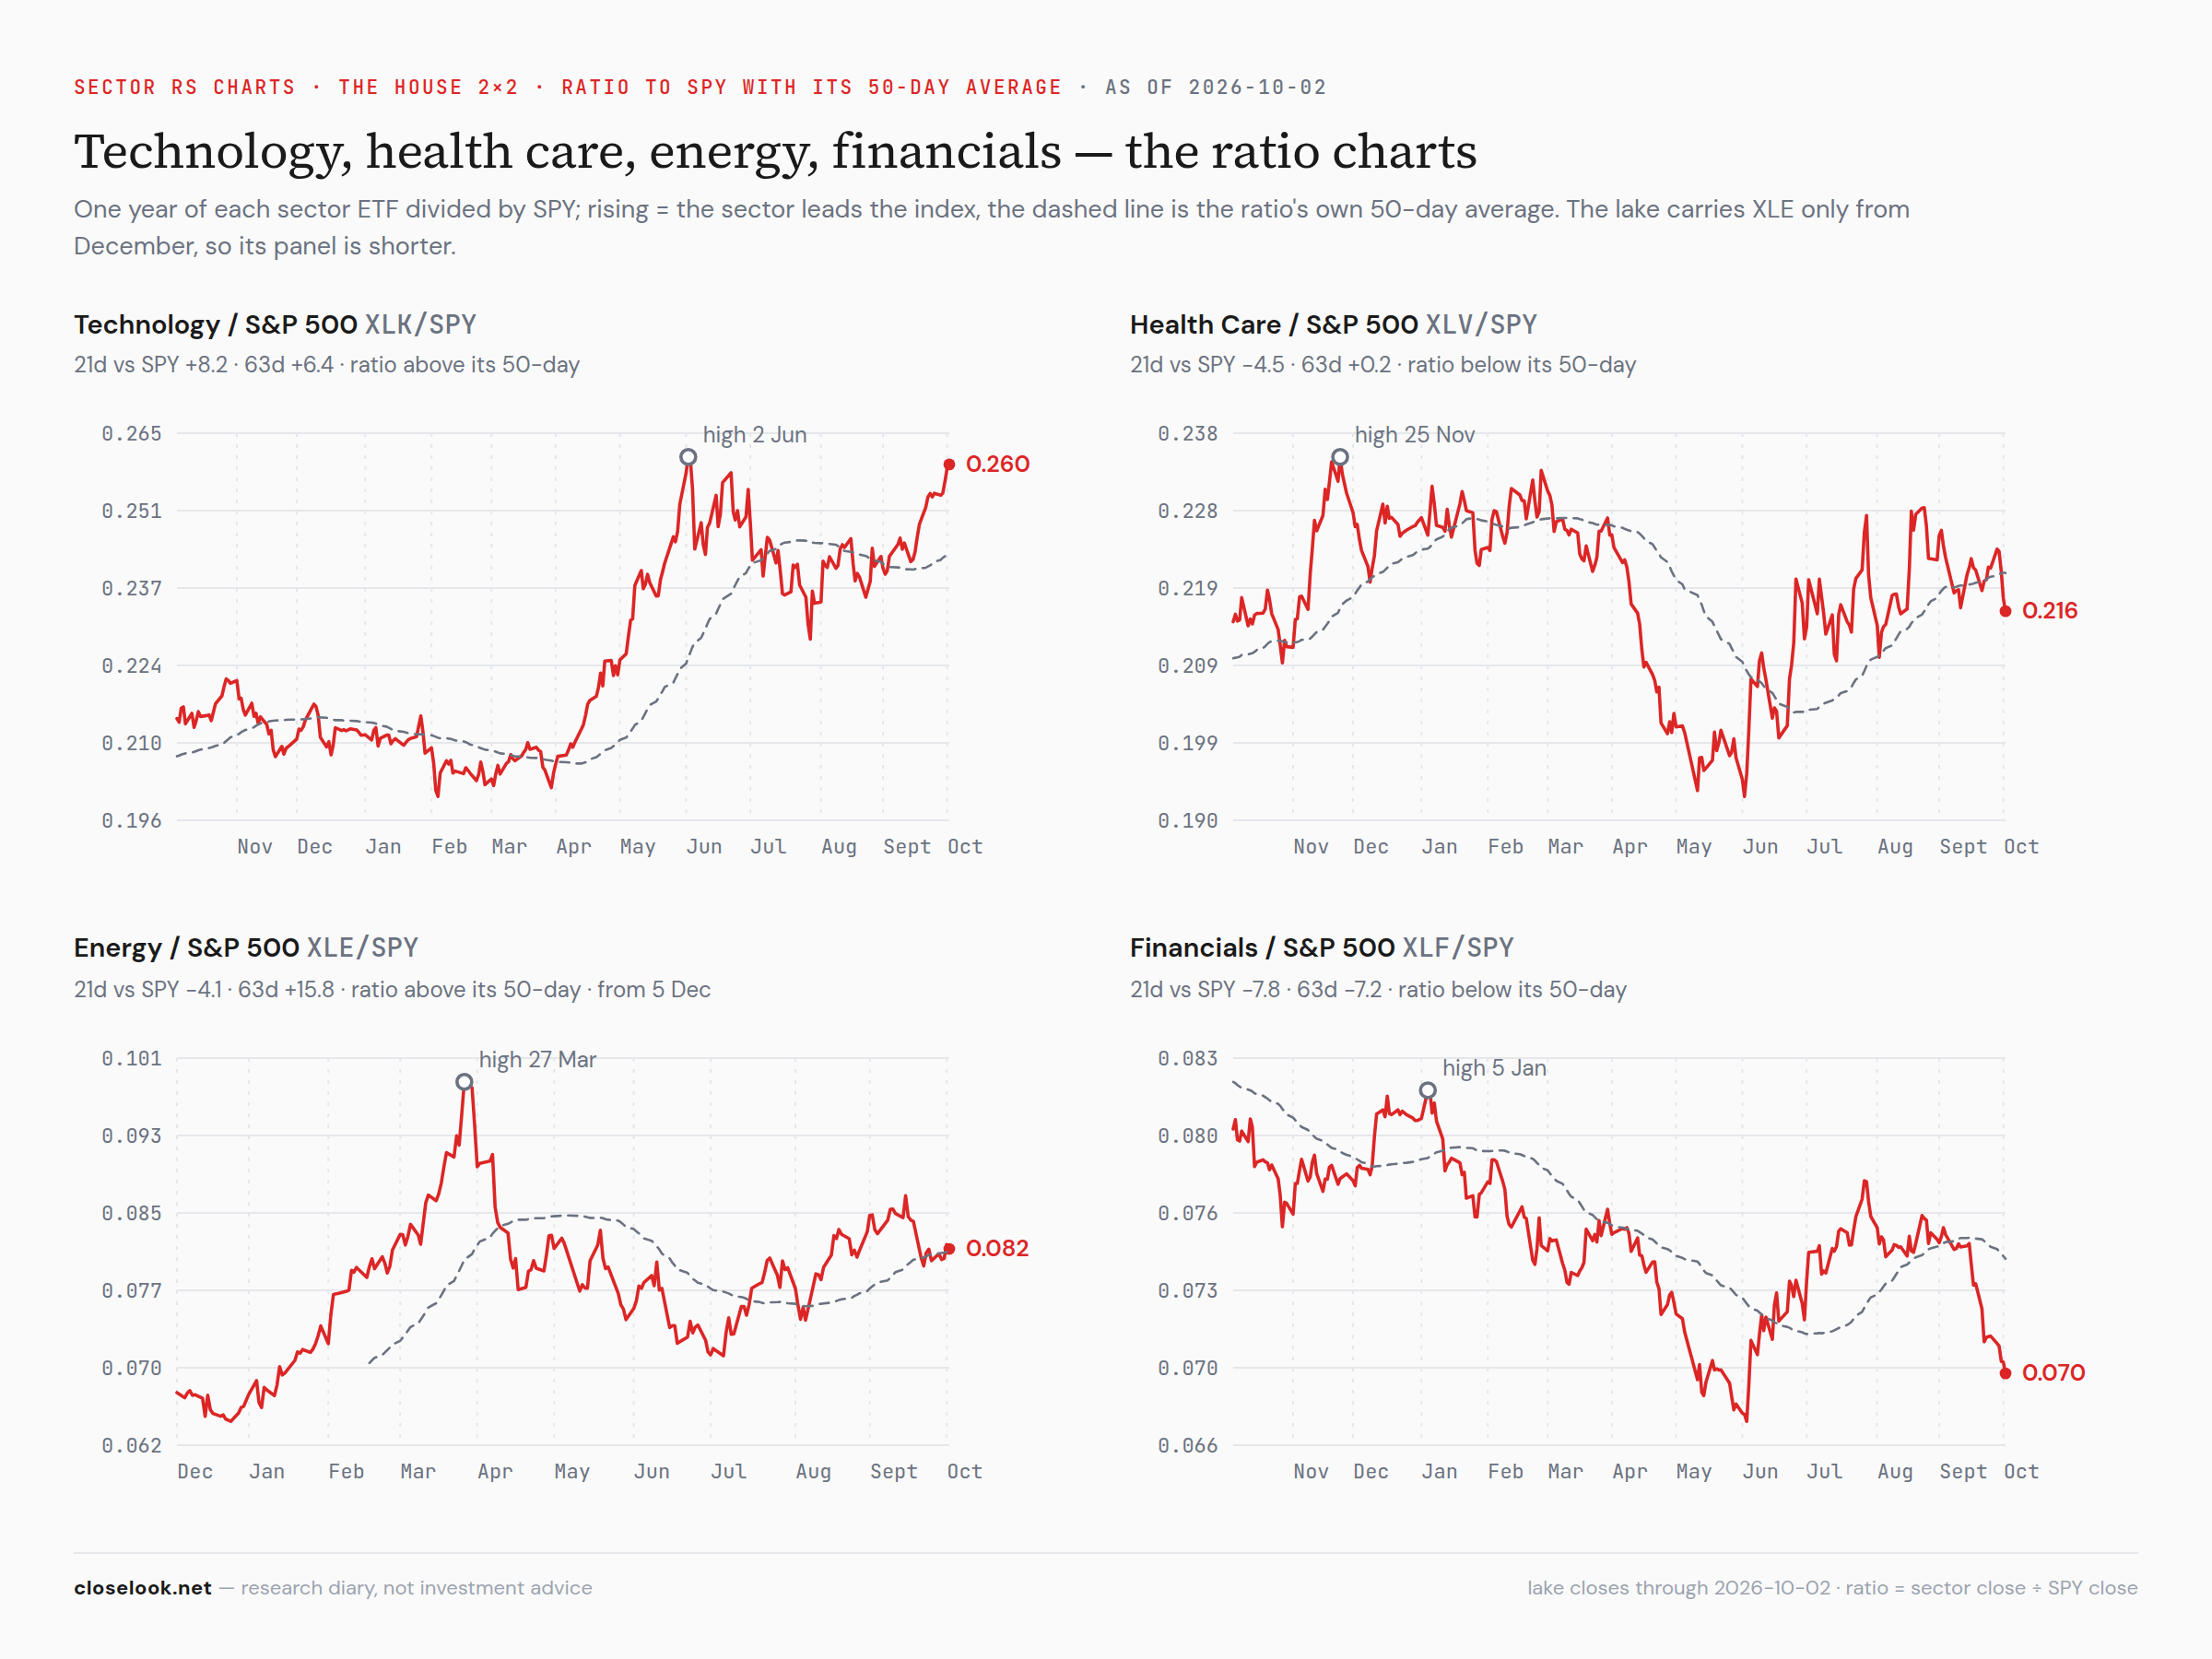
Relative strength — one sector ahead on every window. Against the S&P over the last month, technology is +8.2 points ahead and every other sector behind — financials −7.8, materials −8.3, utilities −7.2, real estate −7.3, staples −6.4, discretionary −4.8, health care −4.5, energy −4.1. Over three months energy +15.8 and technology +6.4 lead, health care is level, and utilities −14.5, industrials −10.9, real estate −10.3, discretionary −9.2 trail. A one-sector month inside a two-sector quarter.
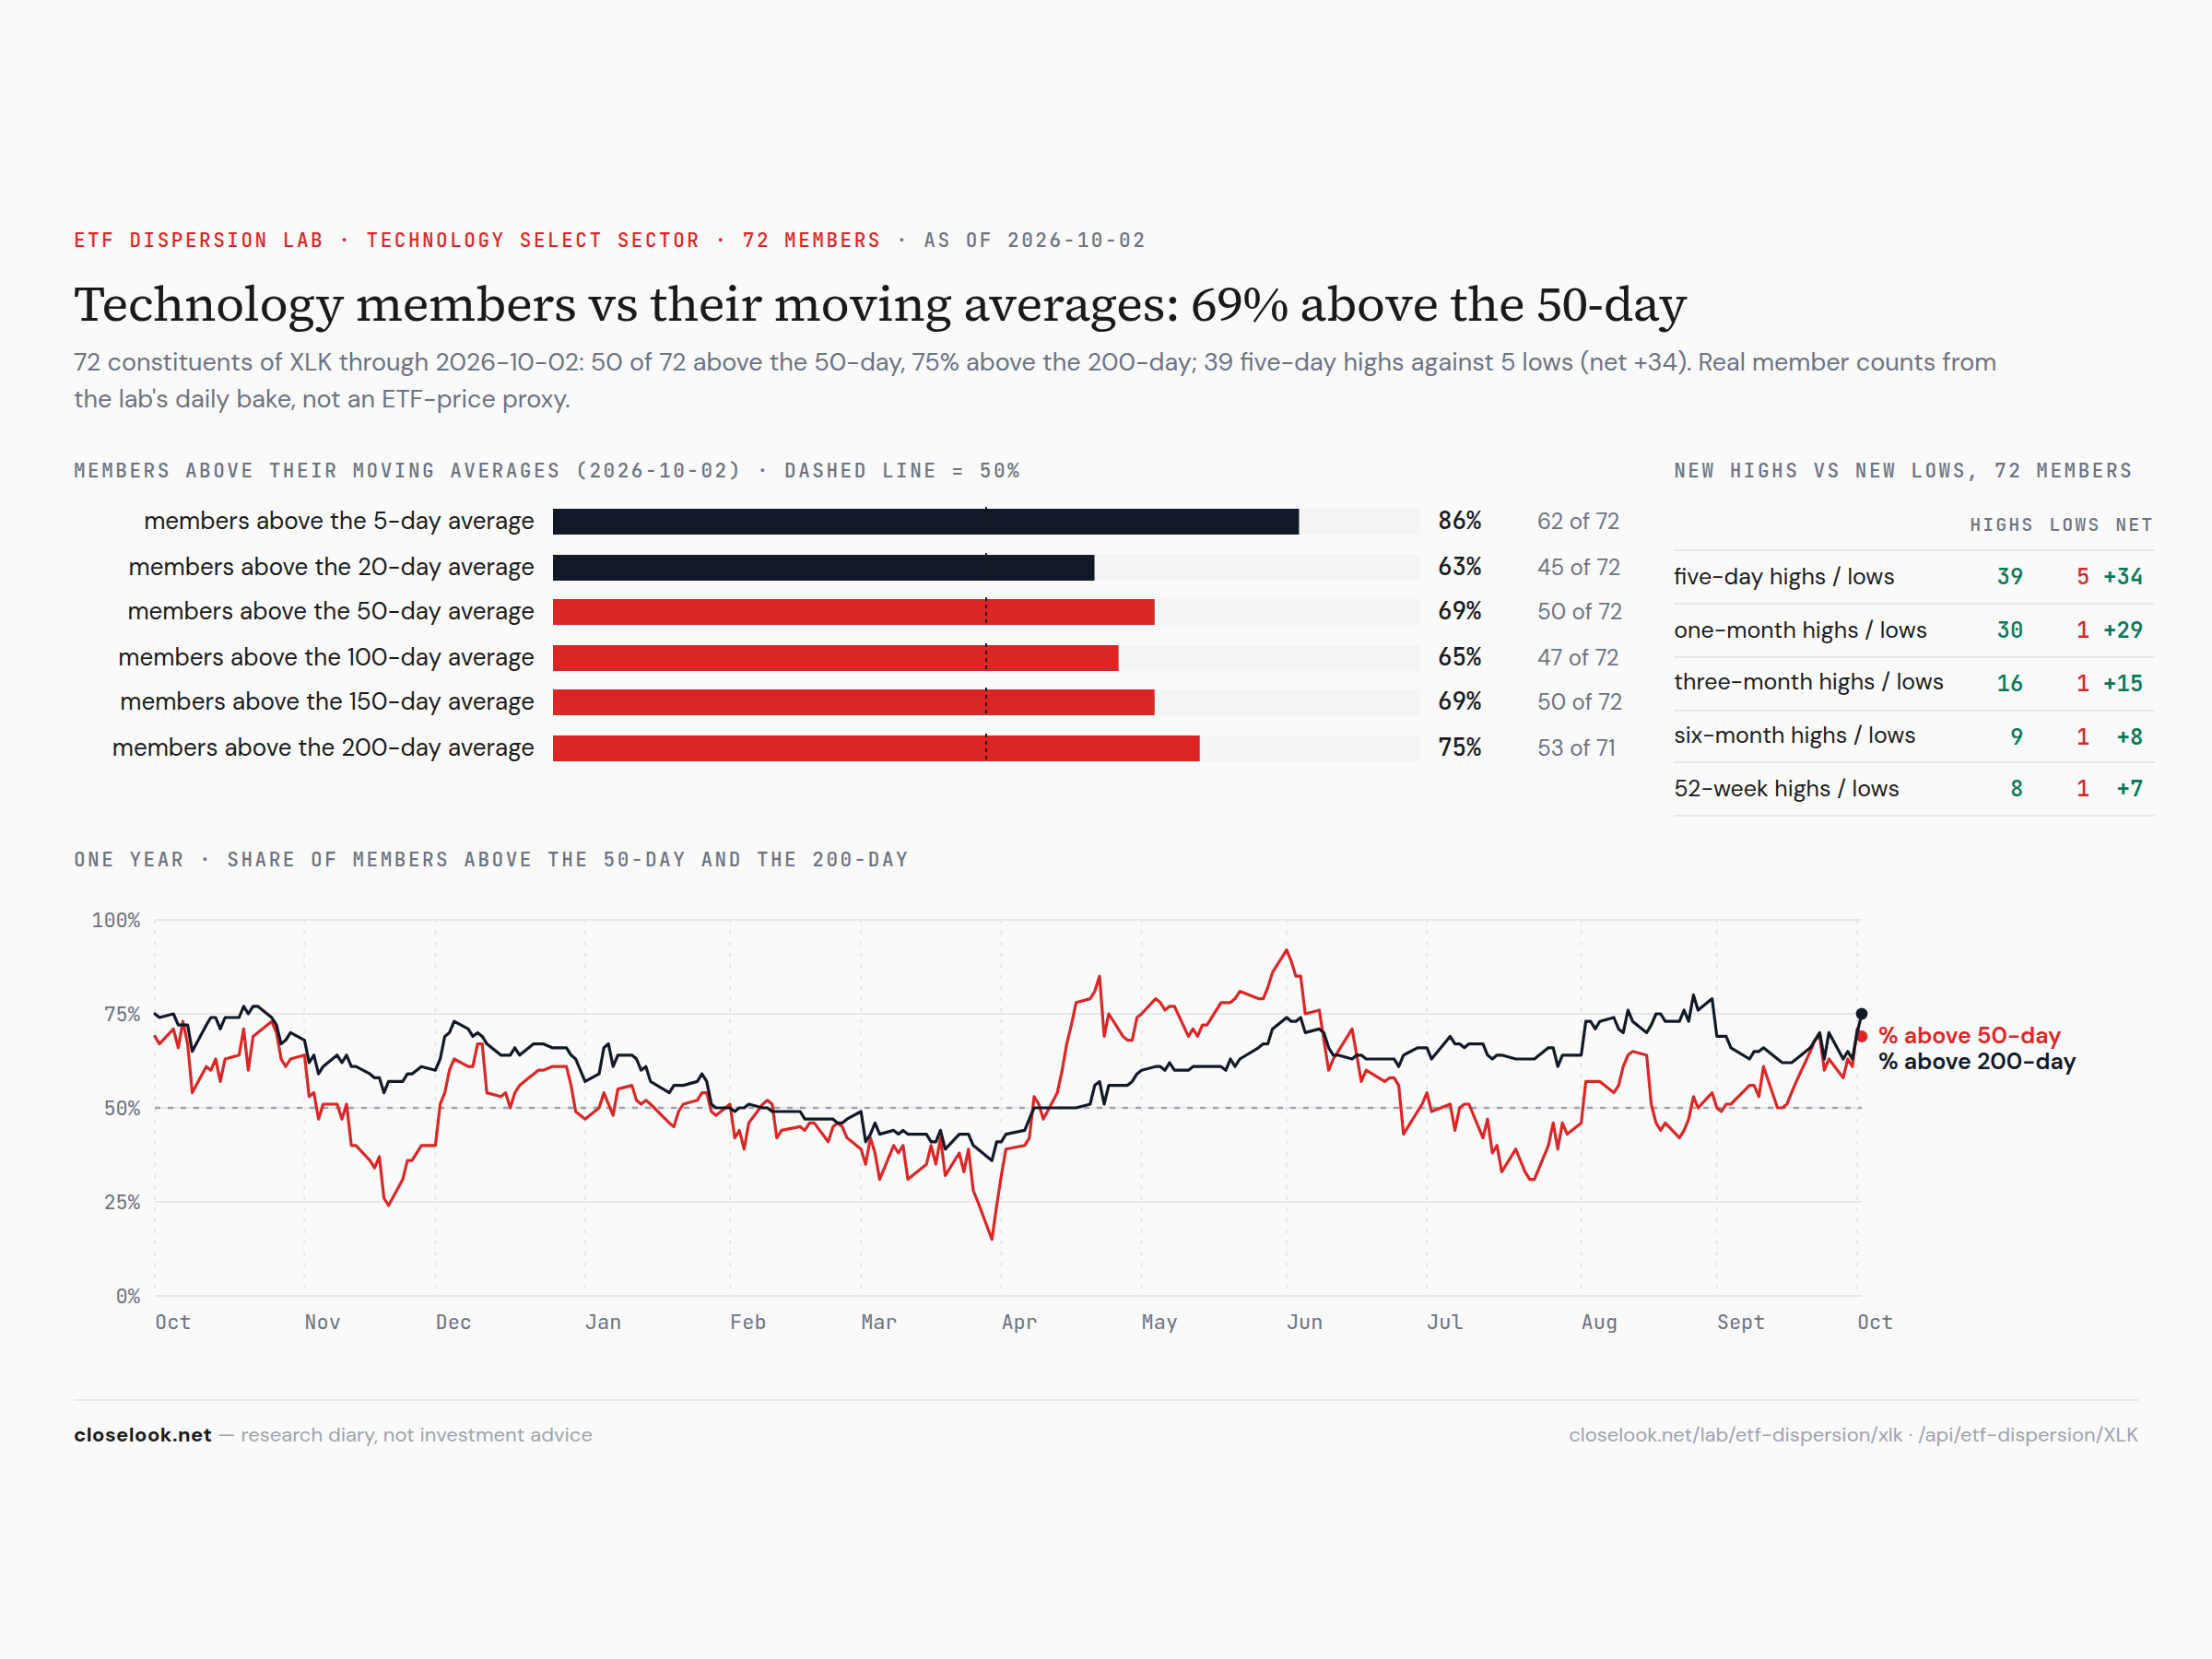
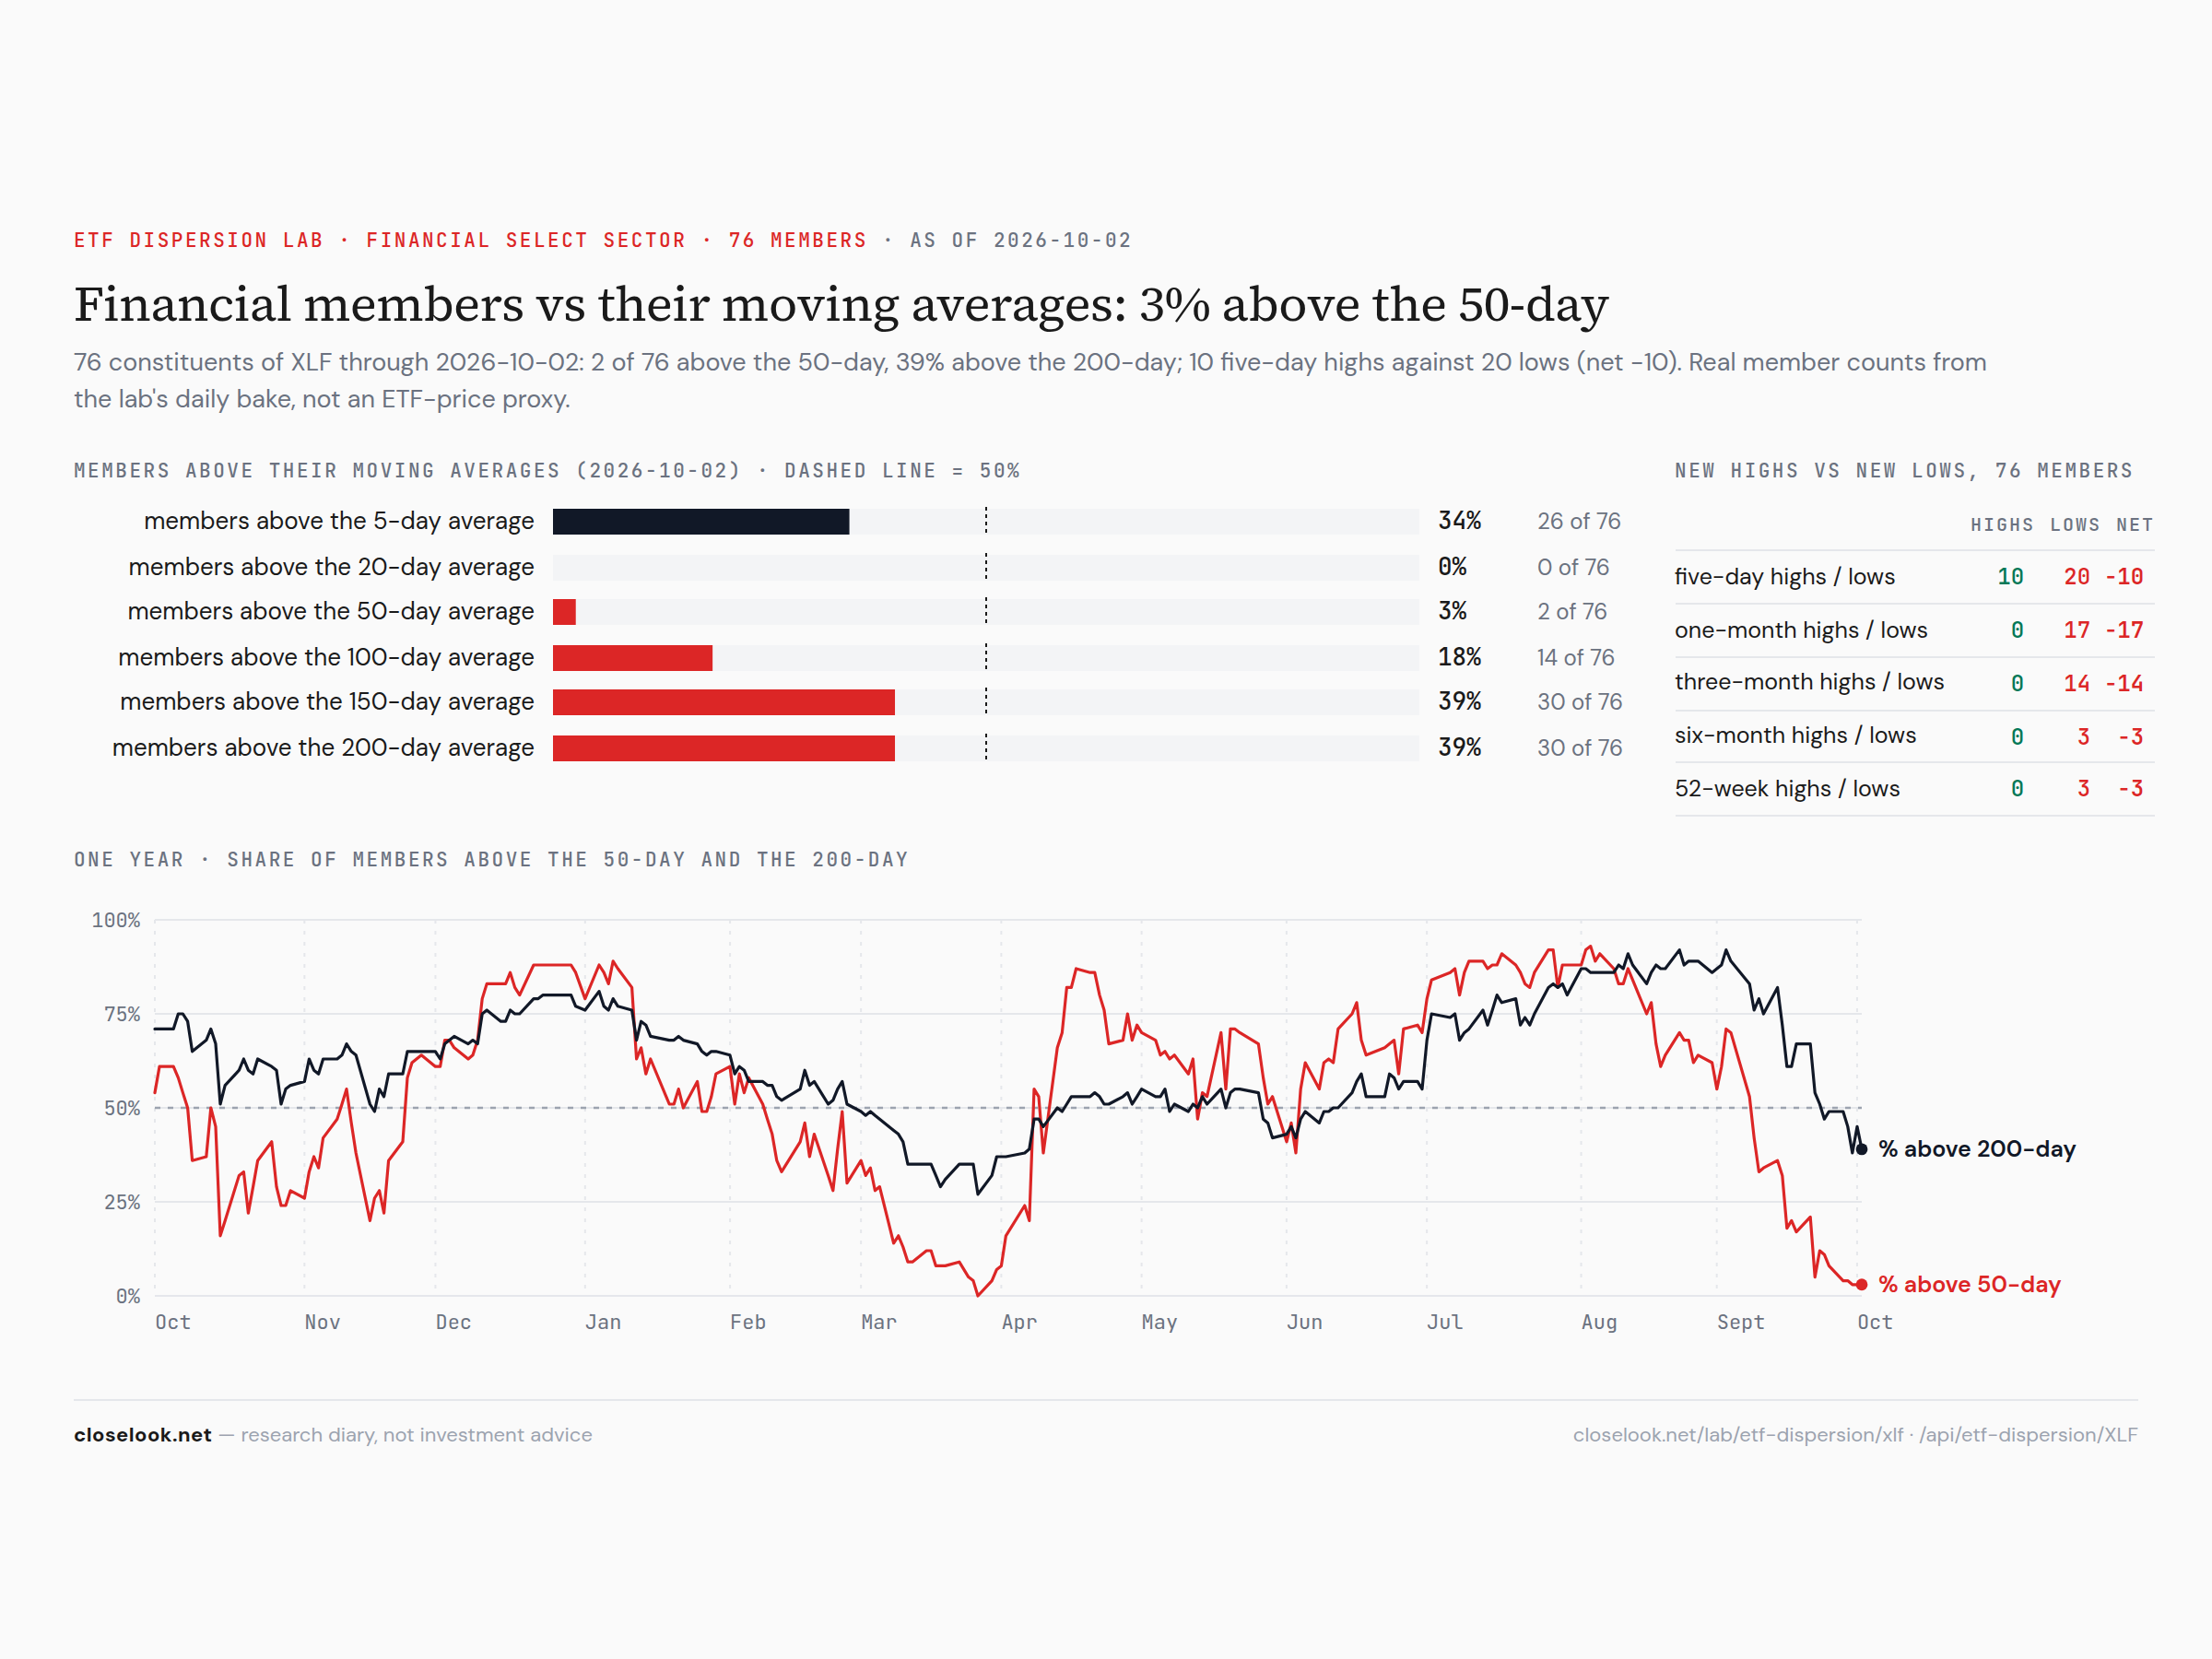
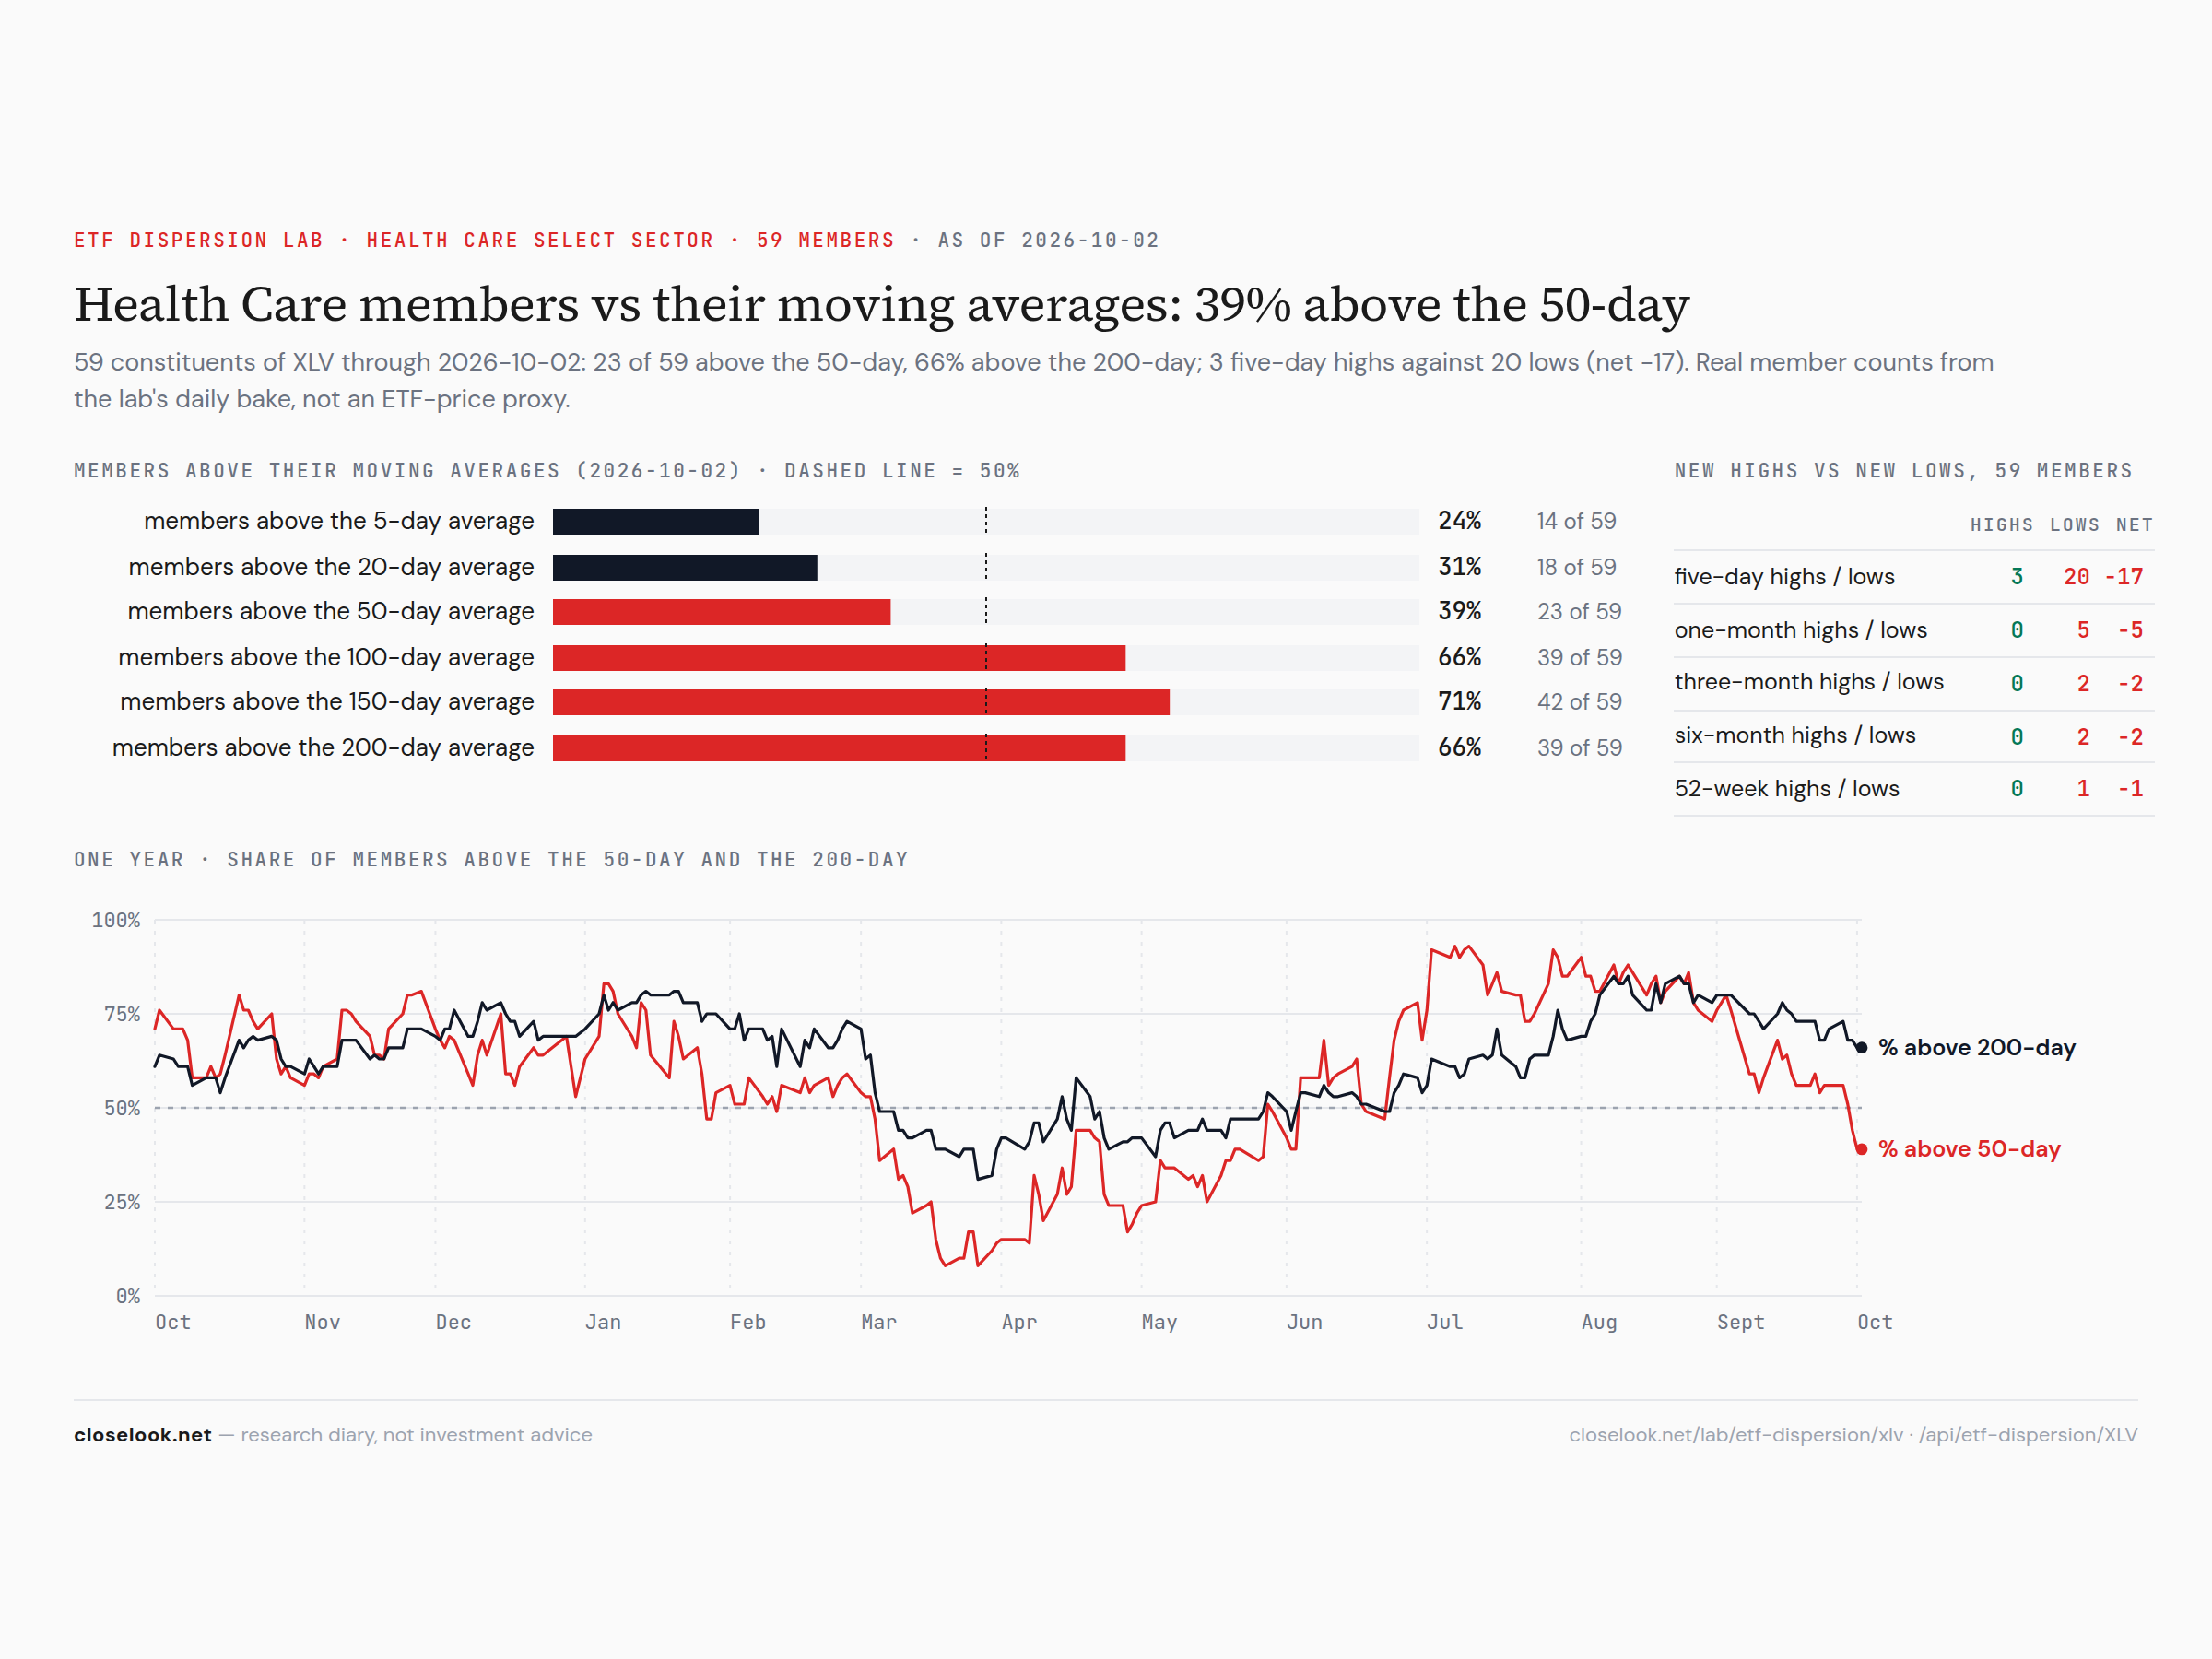
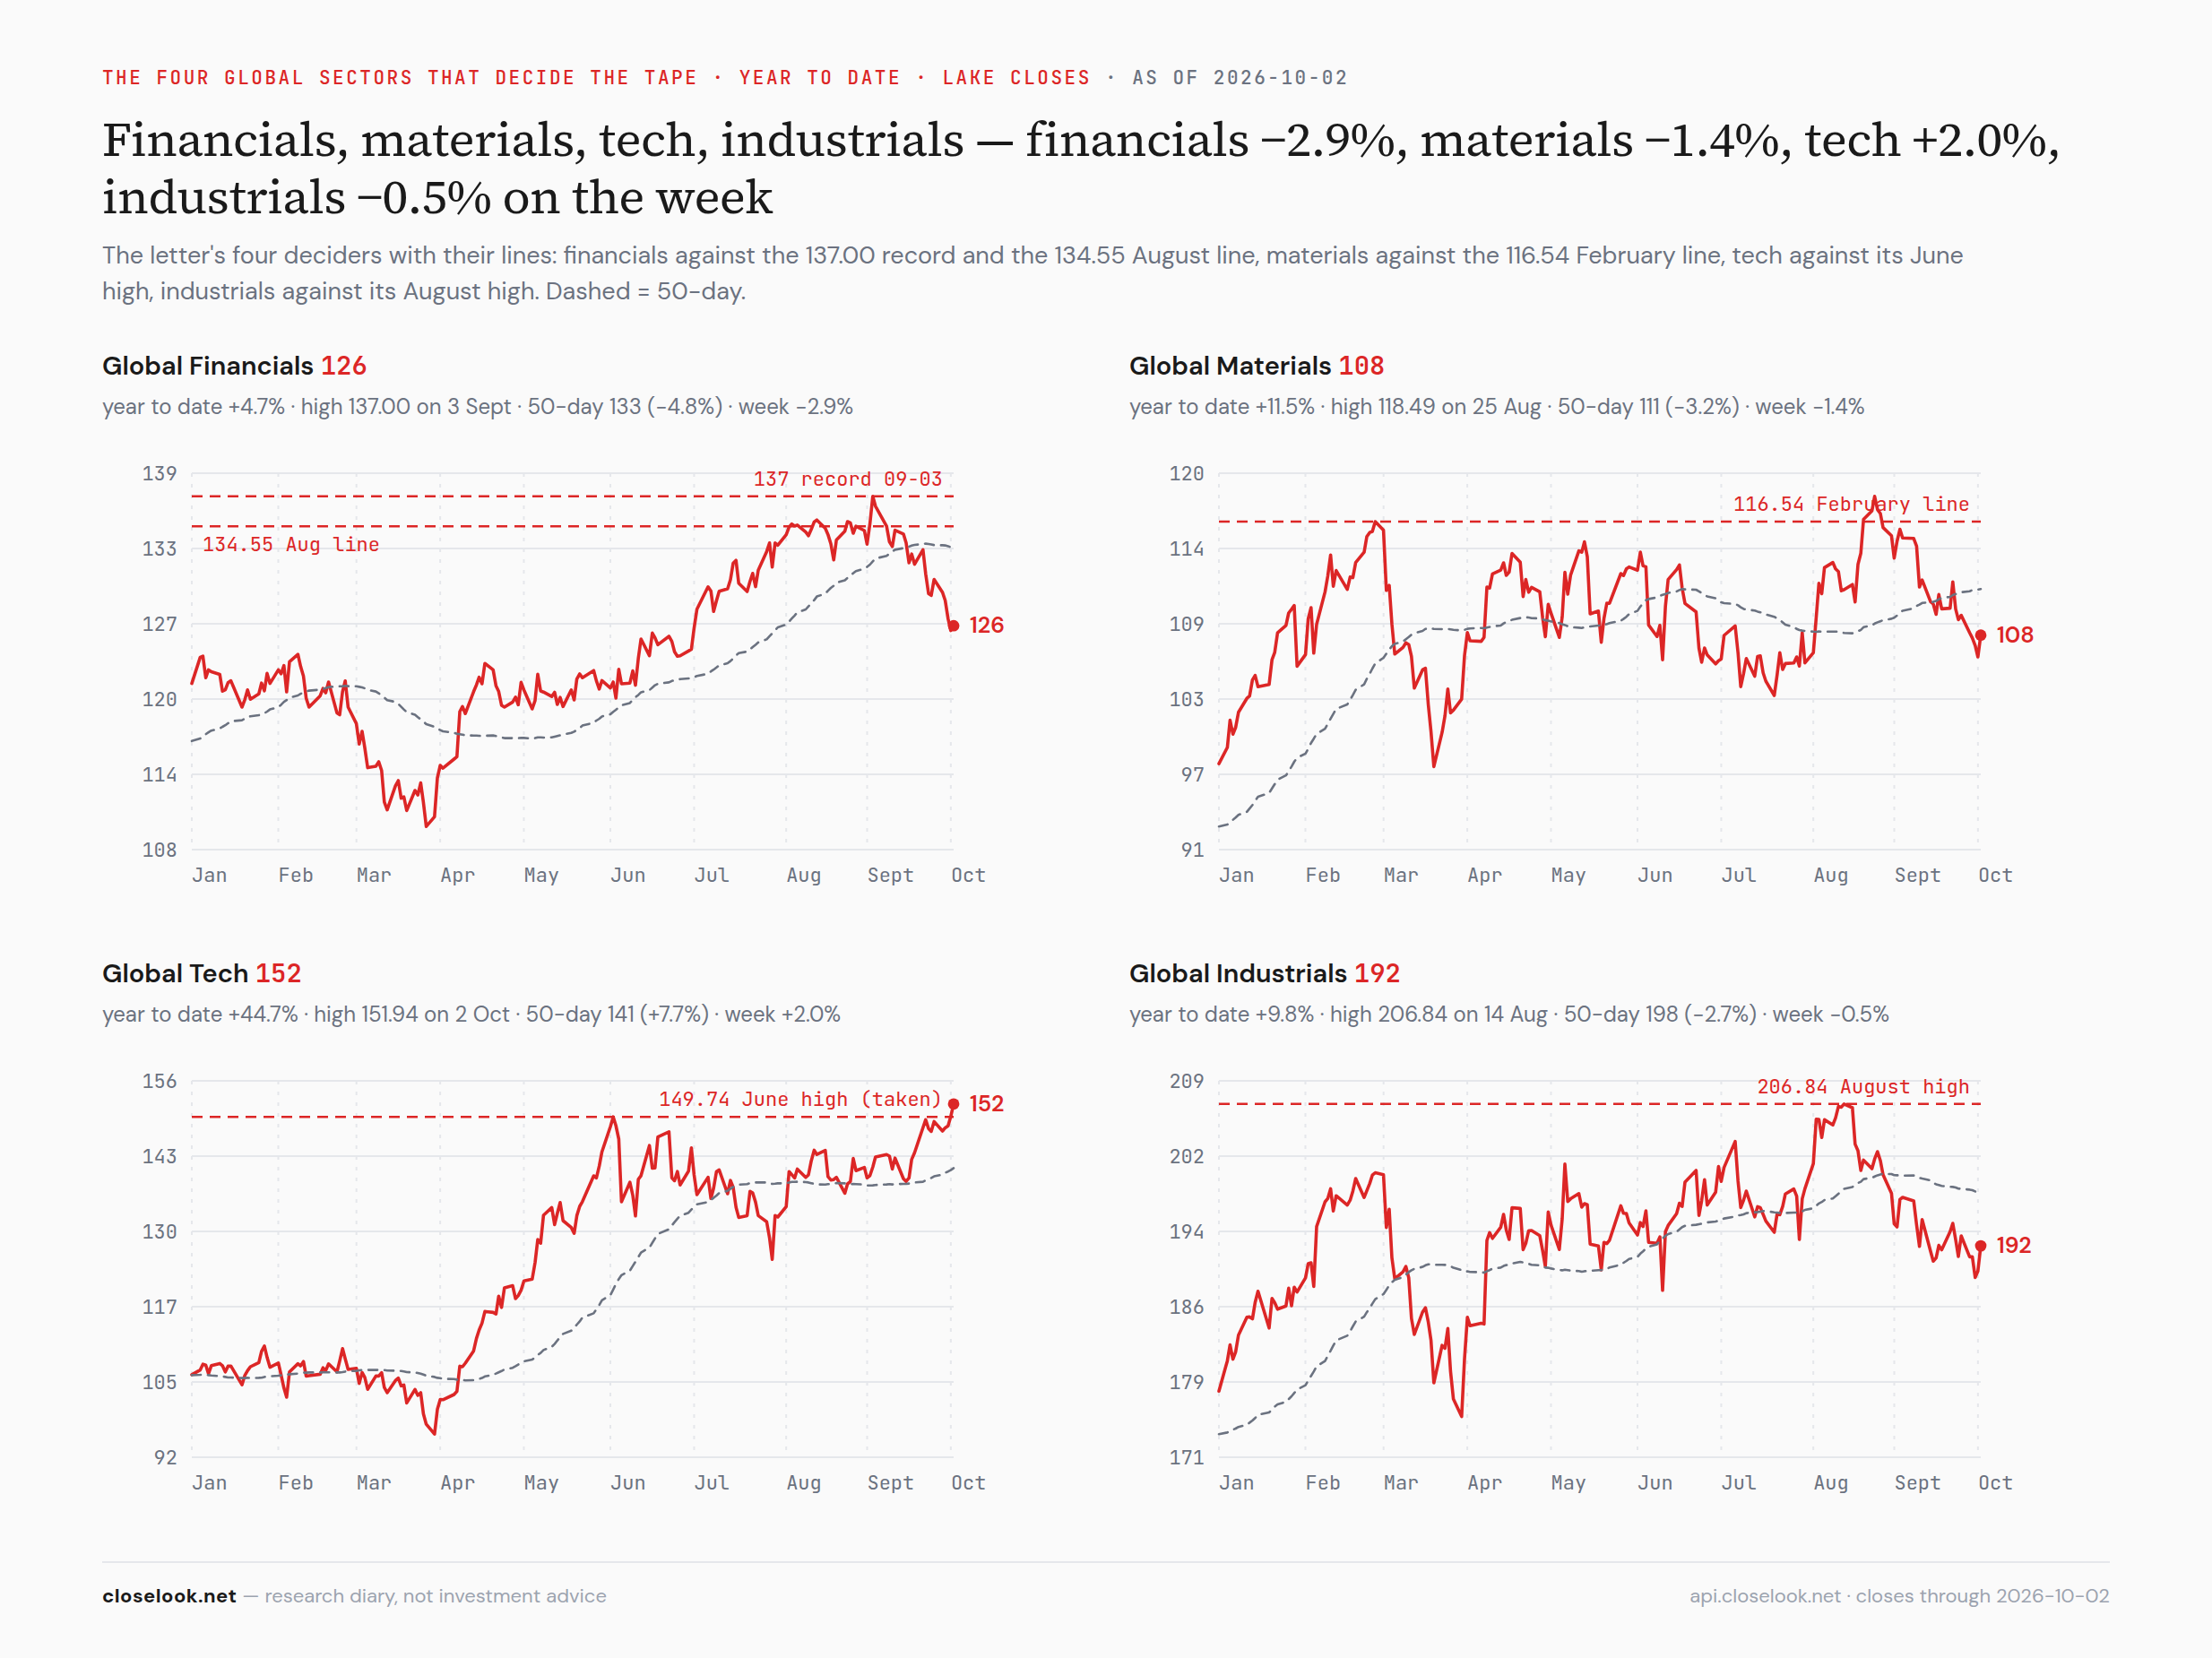
Breadth inside the sectors — a full sector and an empty one. In the tech fund, 86% of the 72 members closed above their 5-day average, 69% above their 50-day and 75% above their 200-day; 39 made a five-day high and 5 a five-day low, and 8 closed at a 52-week high. In financials the picture is the reverse: not one of the 76 members closed above its 20-day average, 2.6% above the 50-day, 39% above the 200-day; 17 made a one-month low and none a one-month high. Health care sits in between and leaning down: 39% above the 50-day, 20 five-day lows against 3 highs. A record in tech and a sector with no member above its 20-day line, in the same week.
The Nasdaq 100, cut six ways
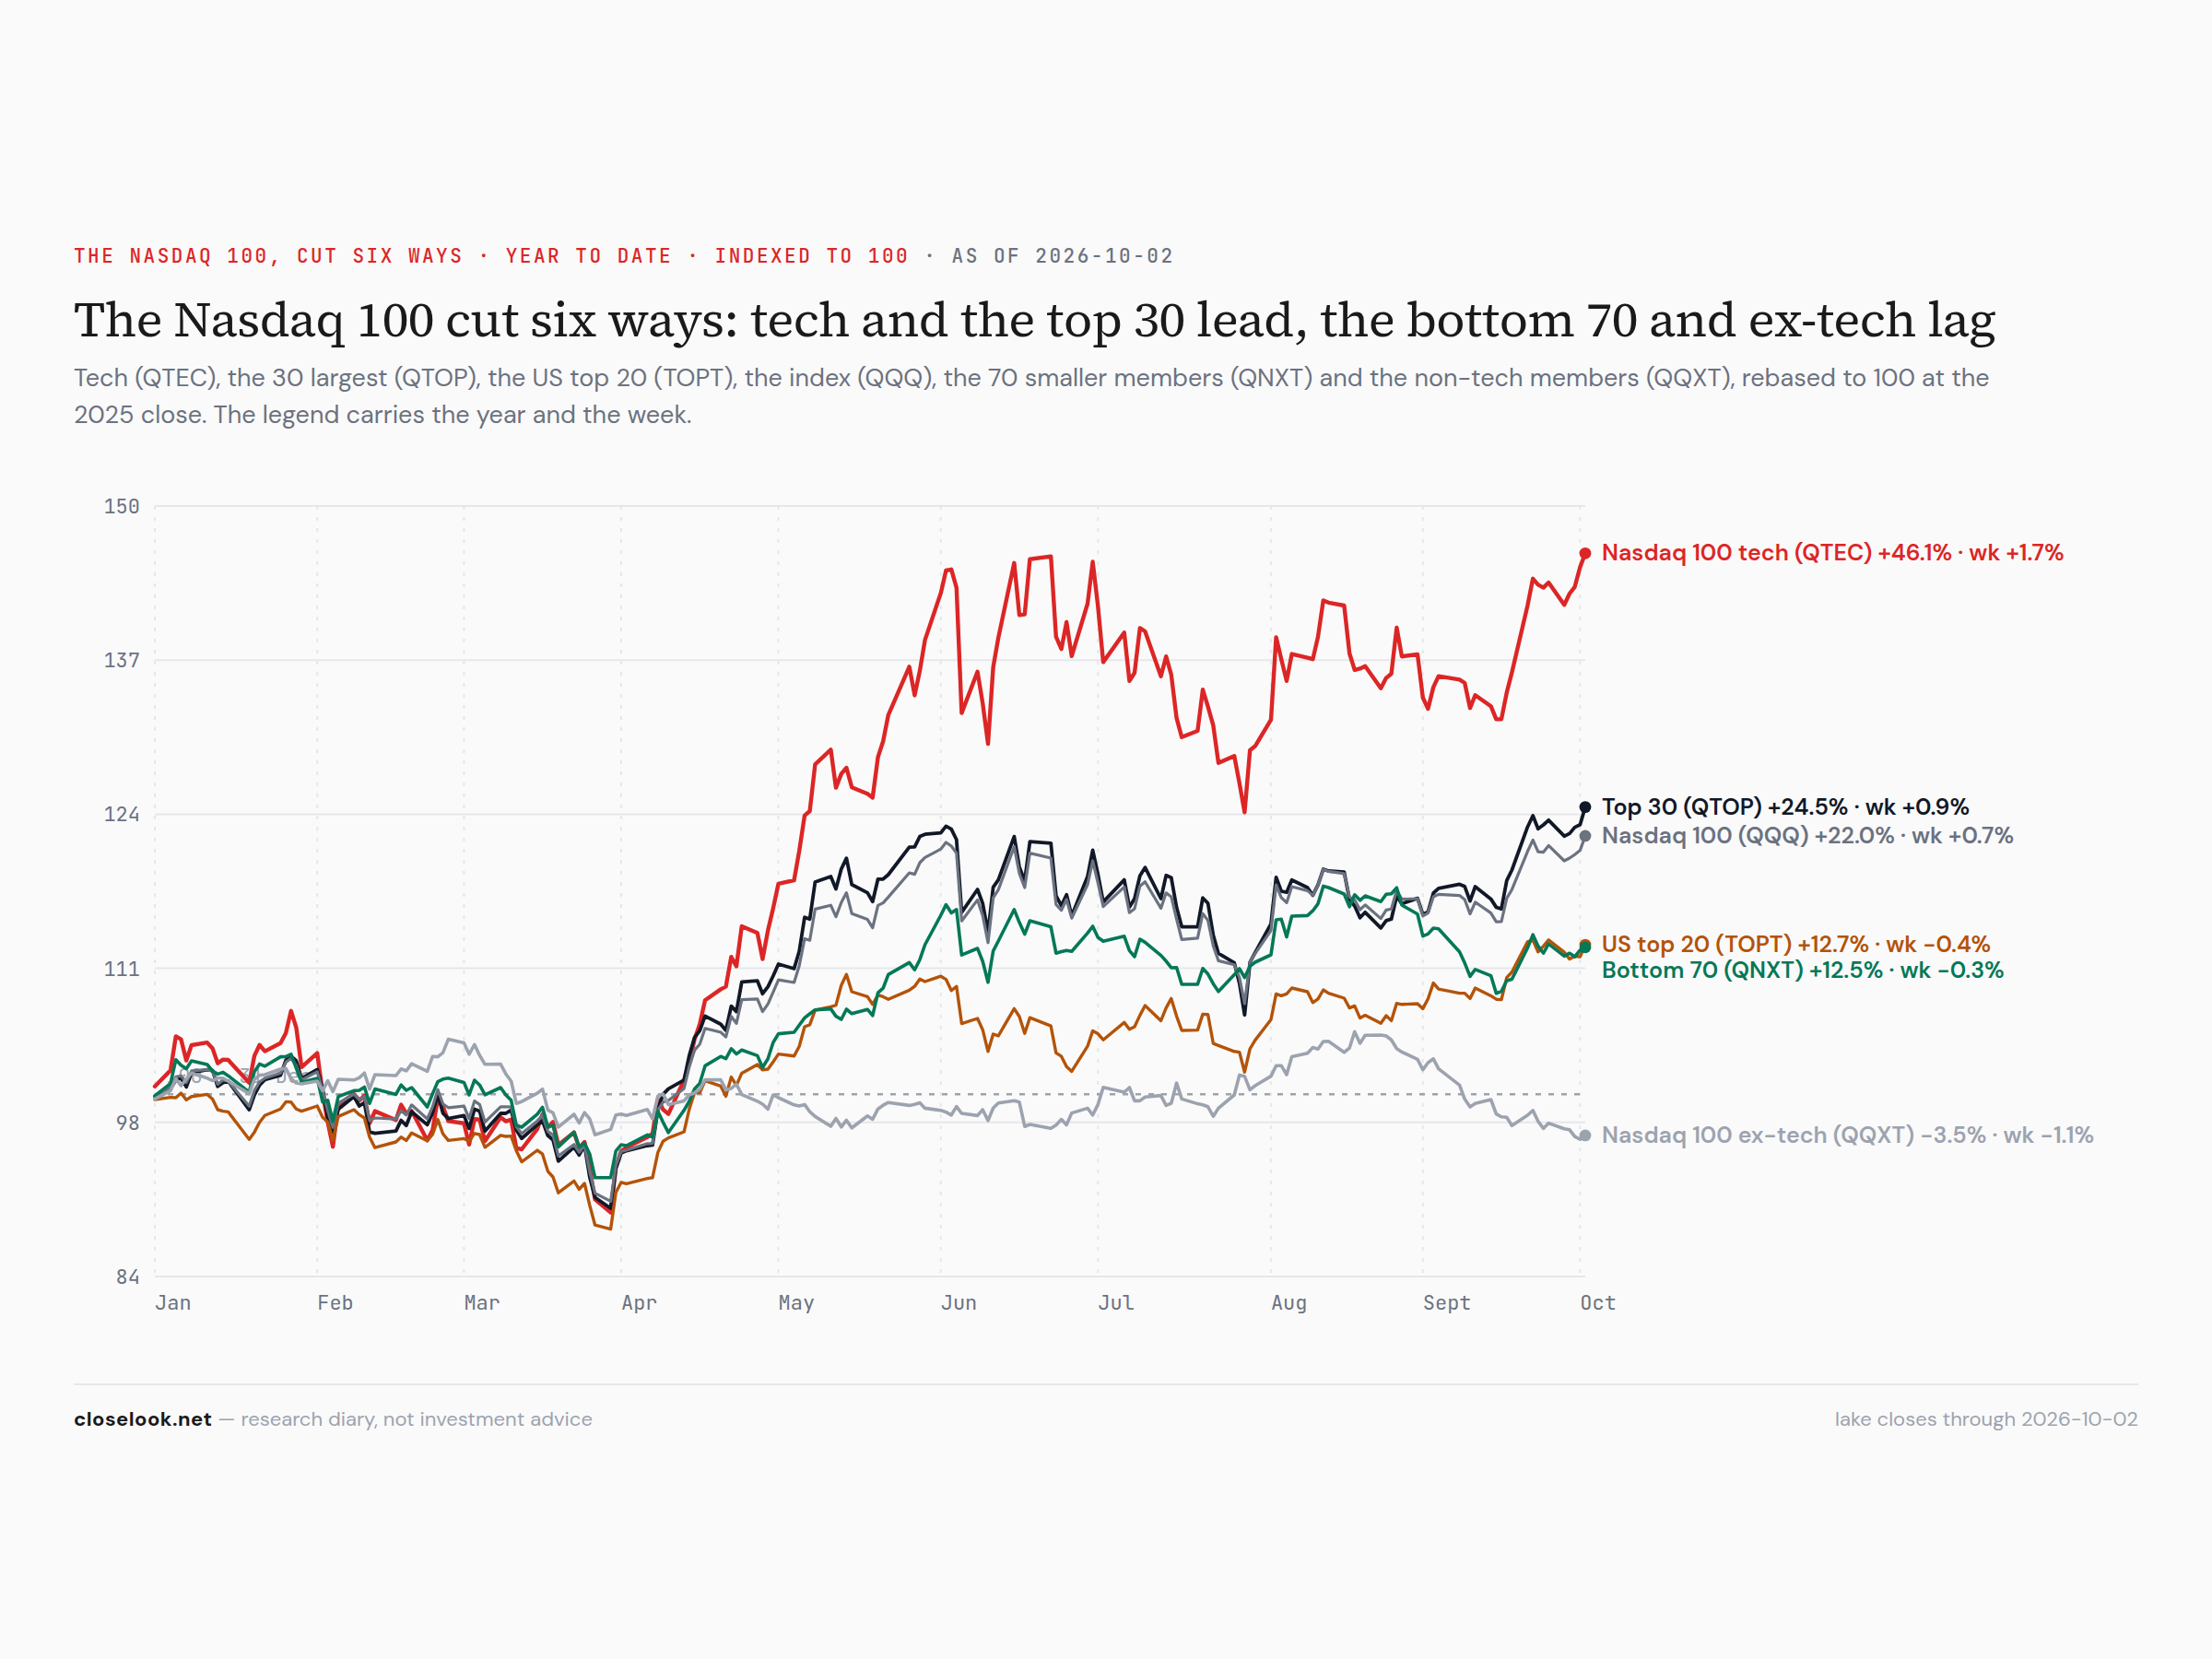
Tech and the top thirty led; the bottom seventy and the non-tech half fell. On the year: Nasdaq 100 tech +46.1% (+1.73% on the week), the top 30 +24.5% (+0.90%), the index +22.0% (+0.68%); the US top 20 +12.7% (−0.37%), the bottom 70 +12.5% (−0.3%), the non-tech members −3.5% (−1.06%). The spread between the tech half and the non-tech half of the same index is now 49.6 points on the year. The index is a record; seventy of its hundred members are not part of the record.
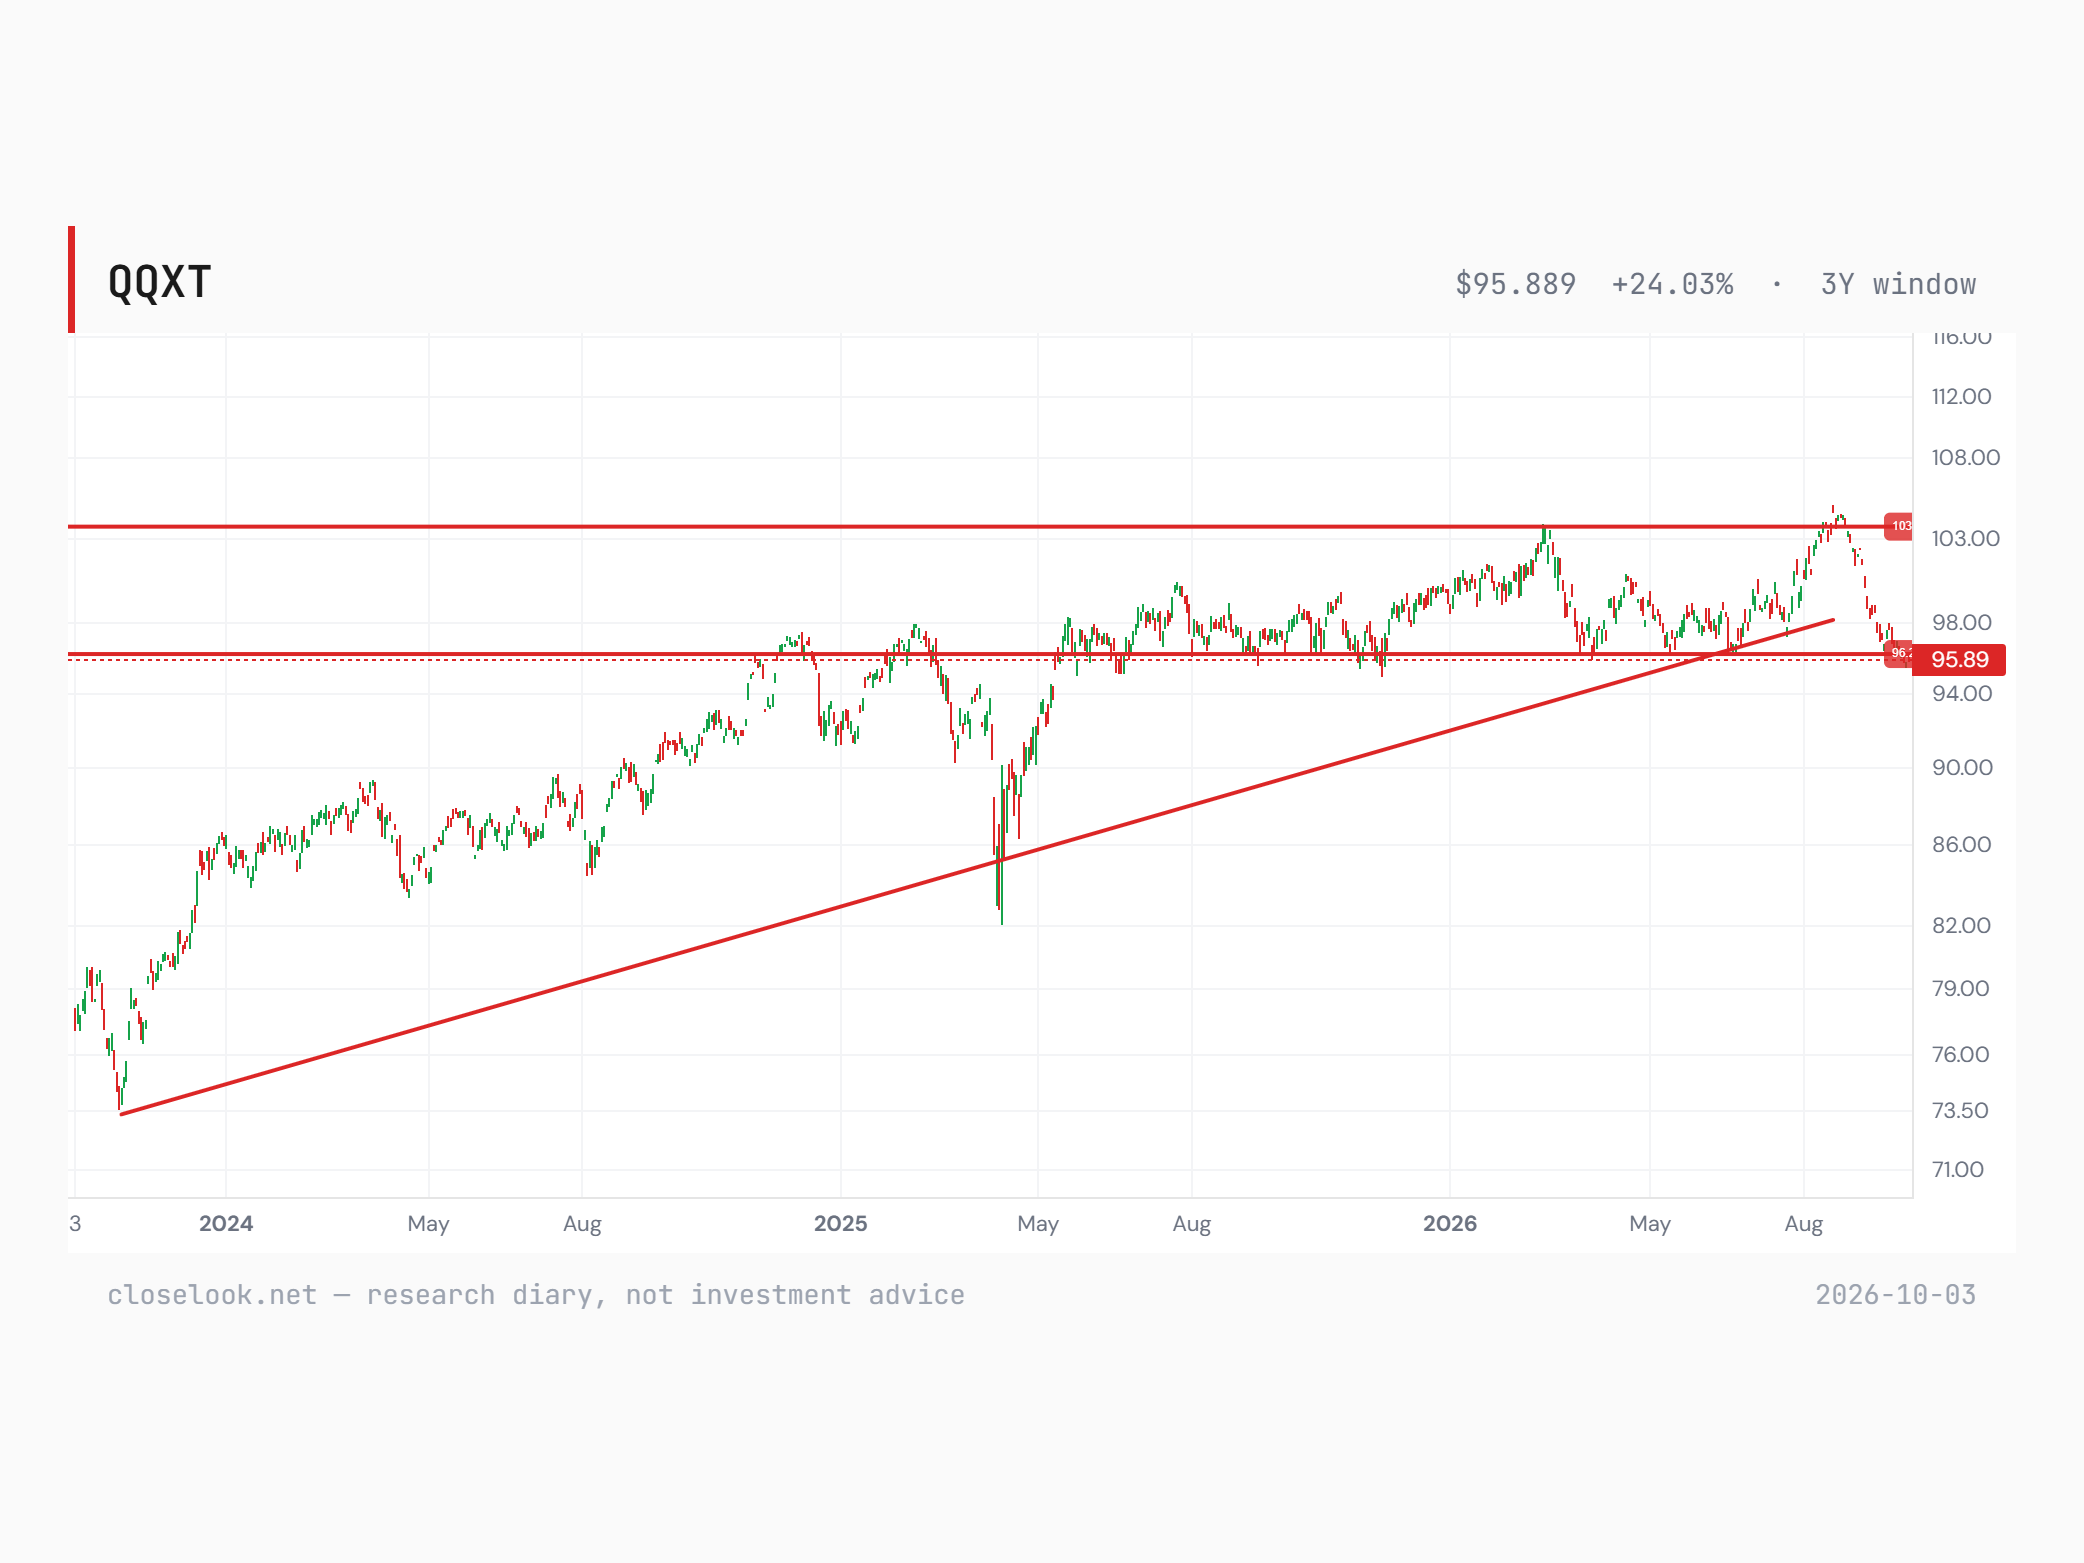
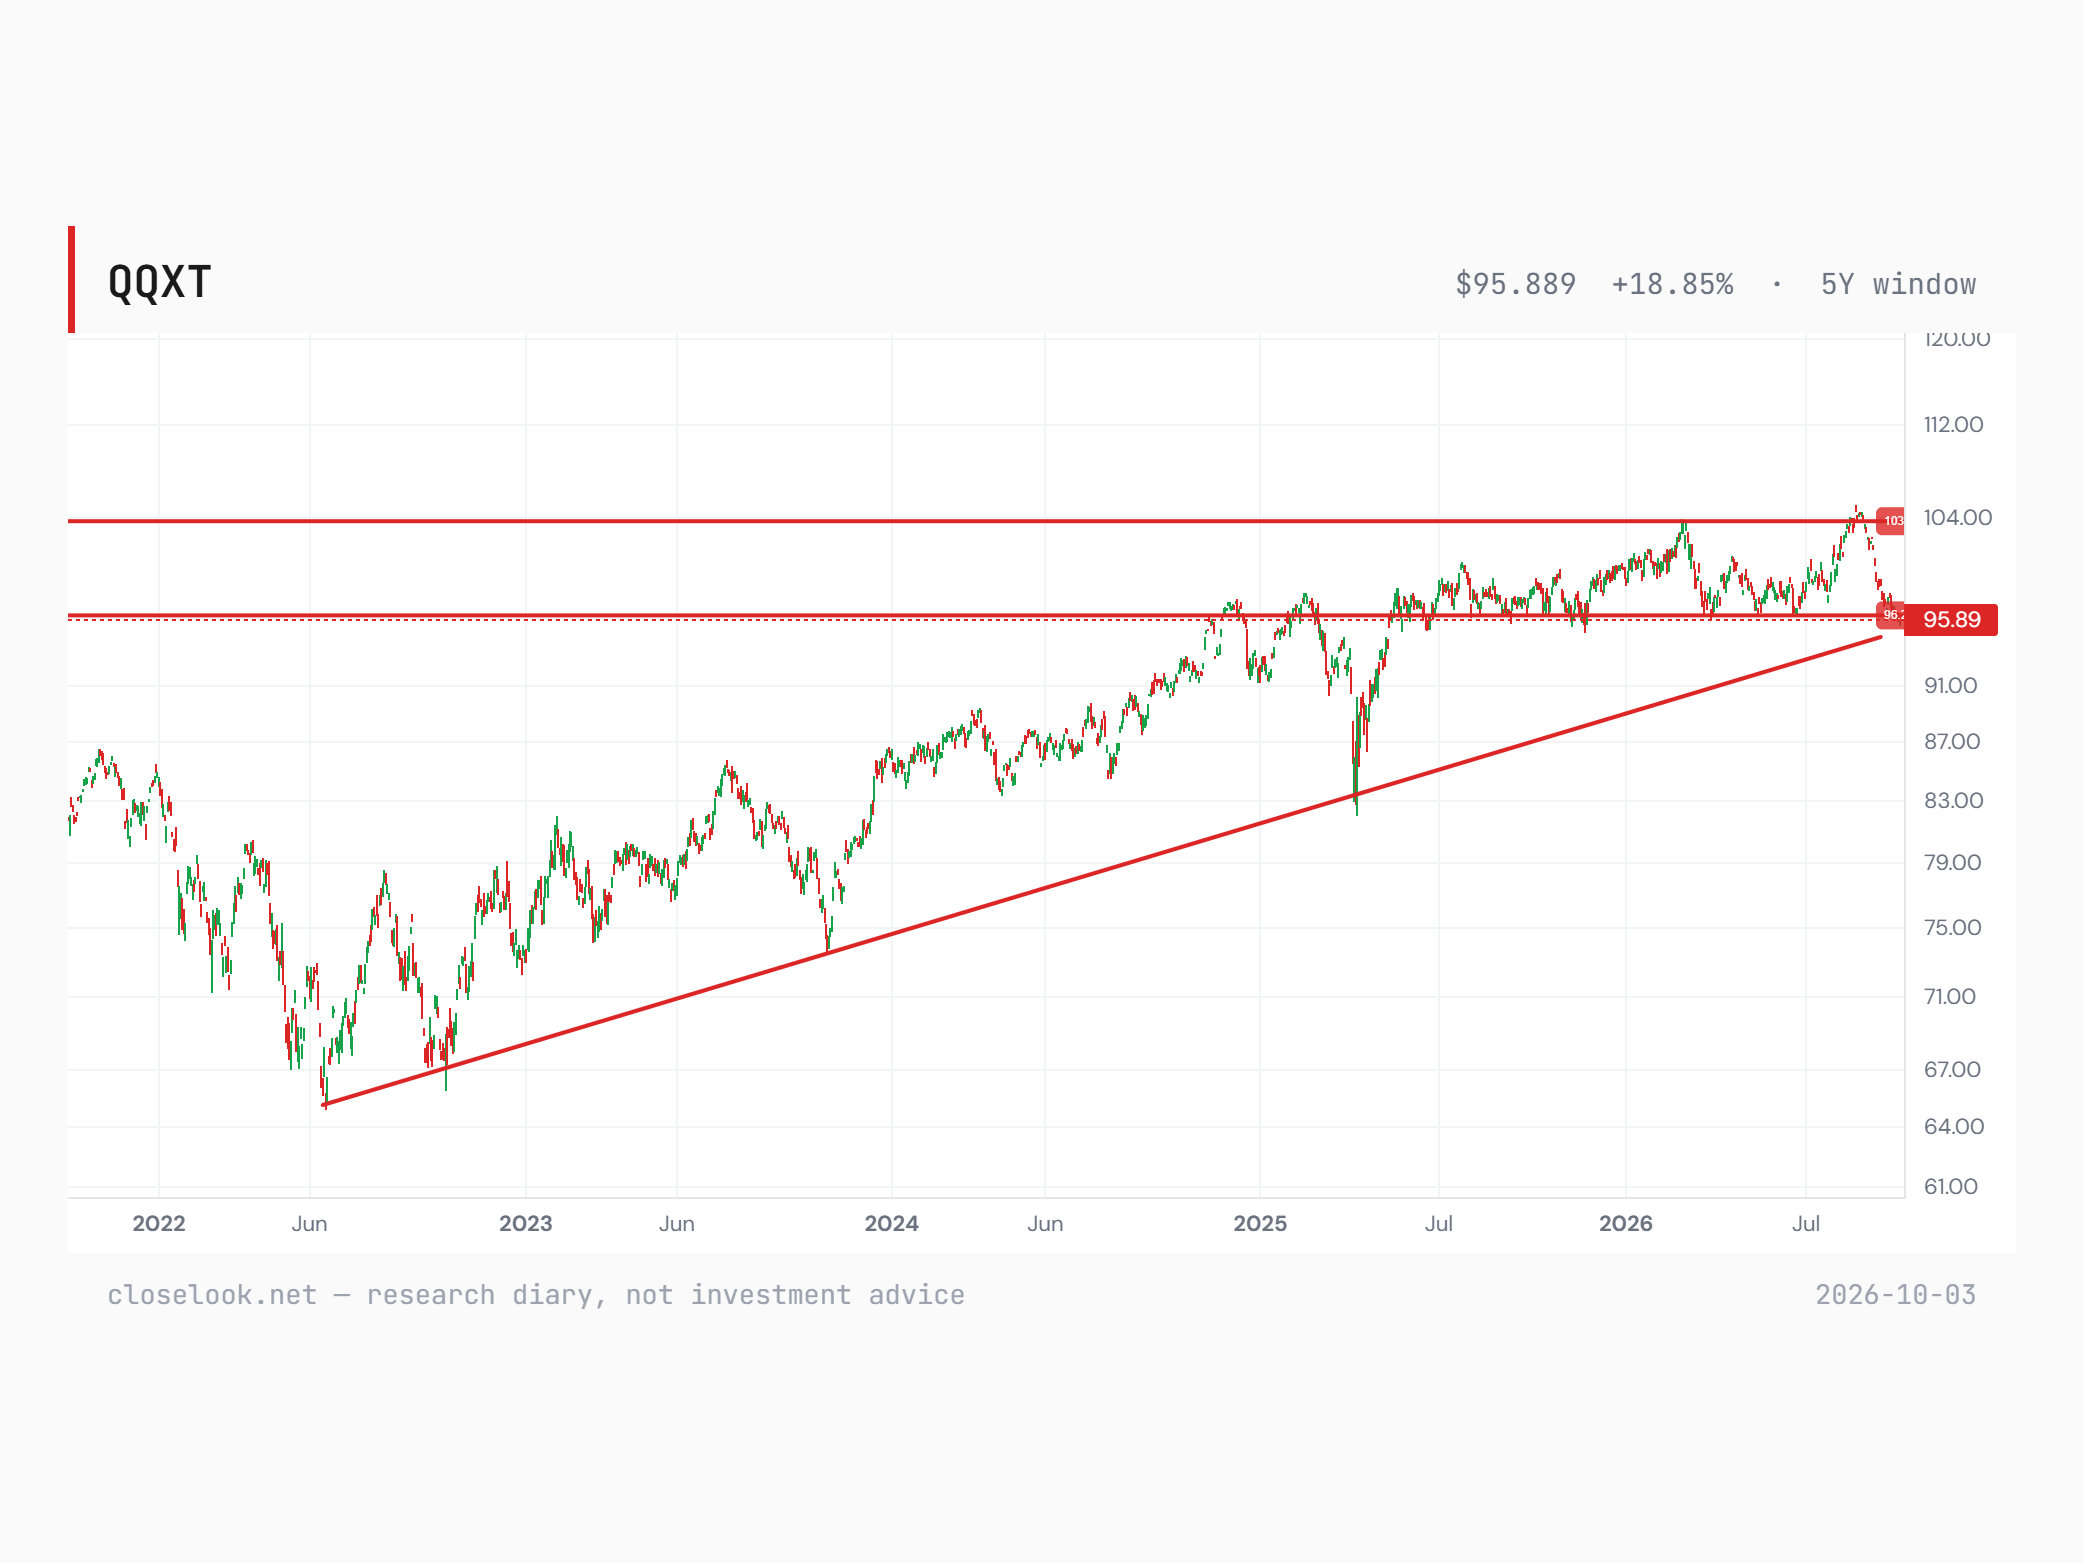
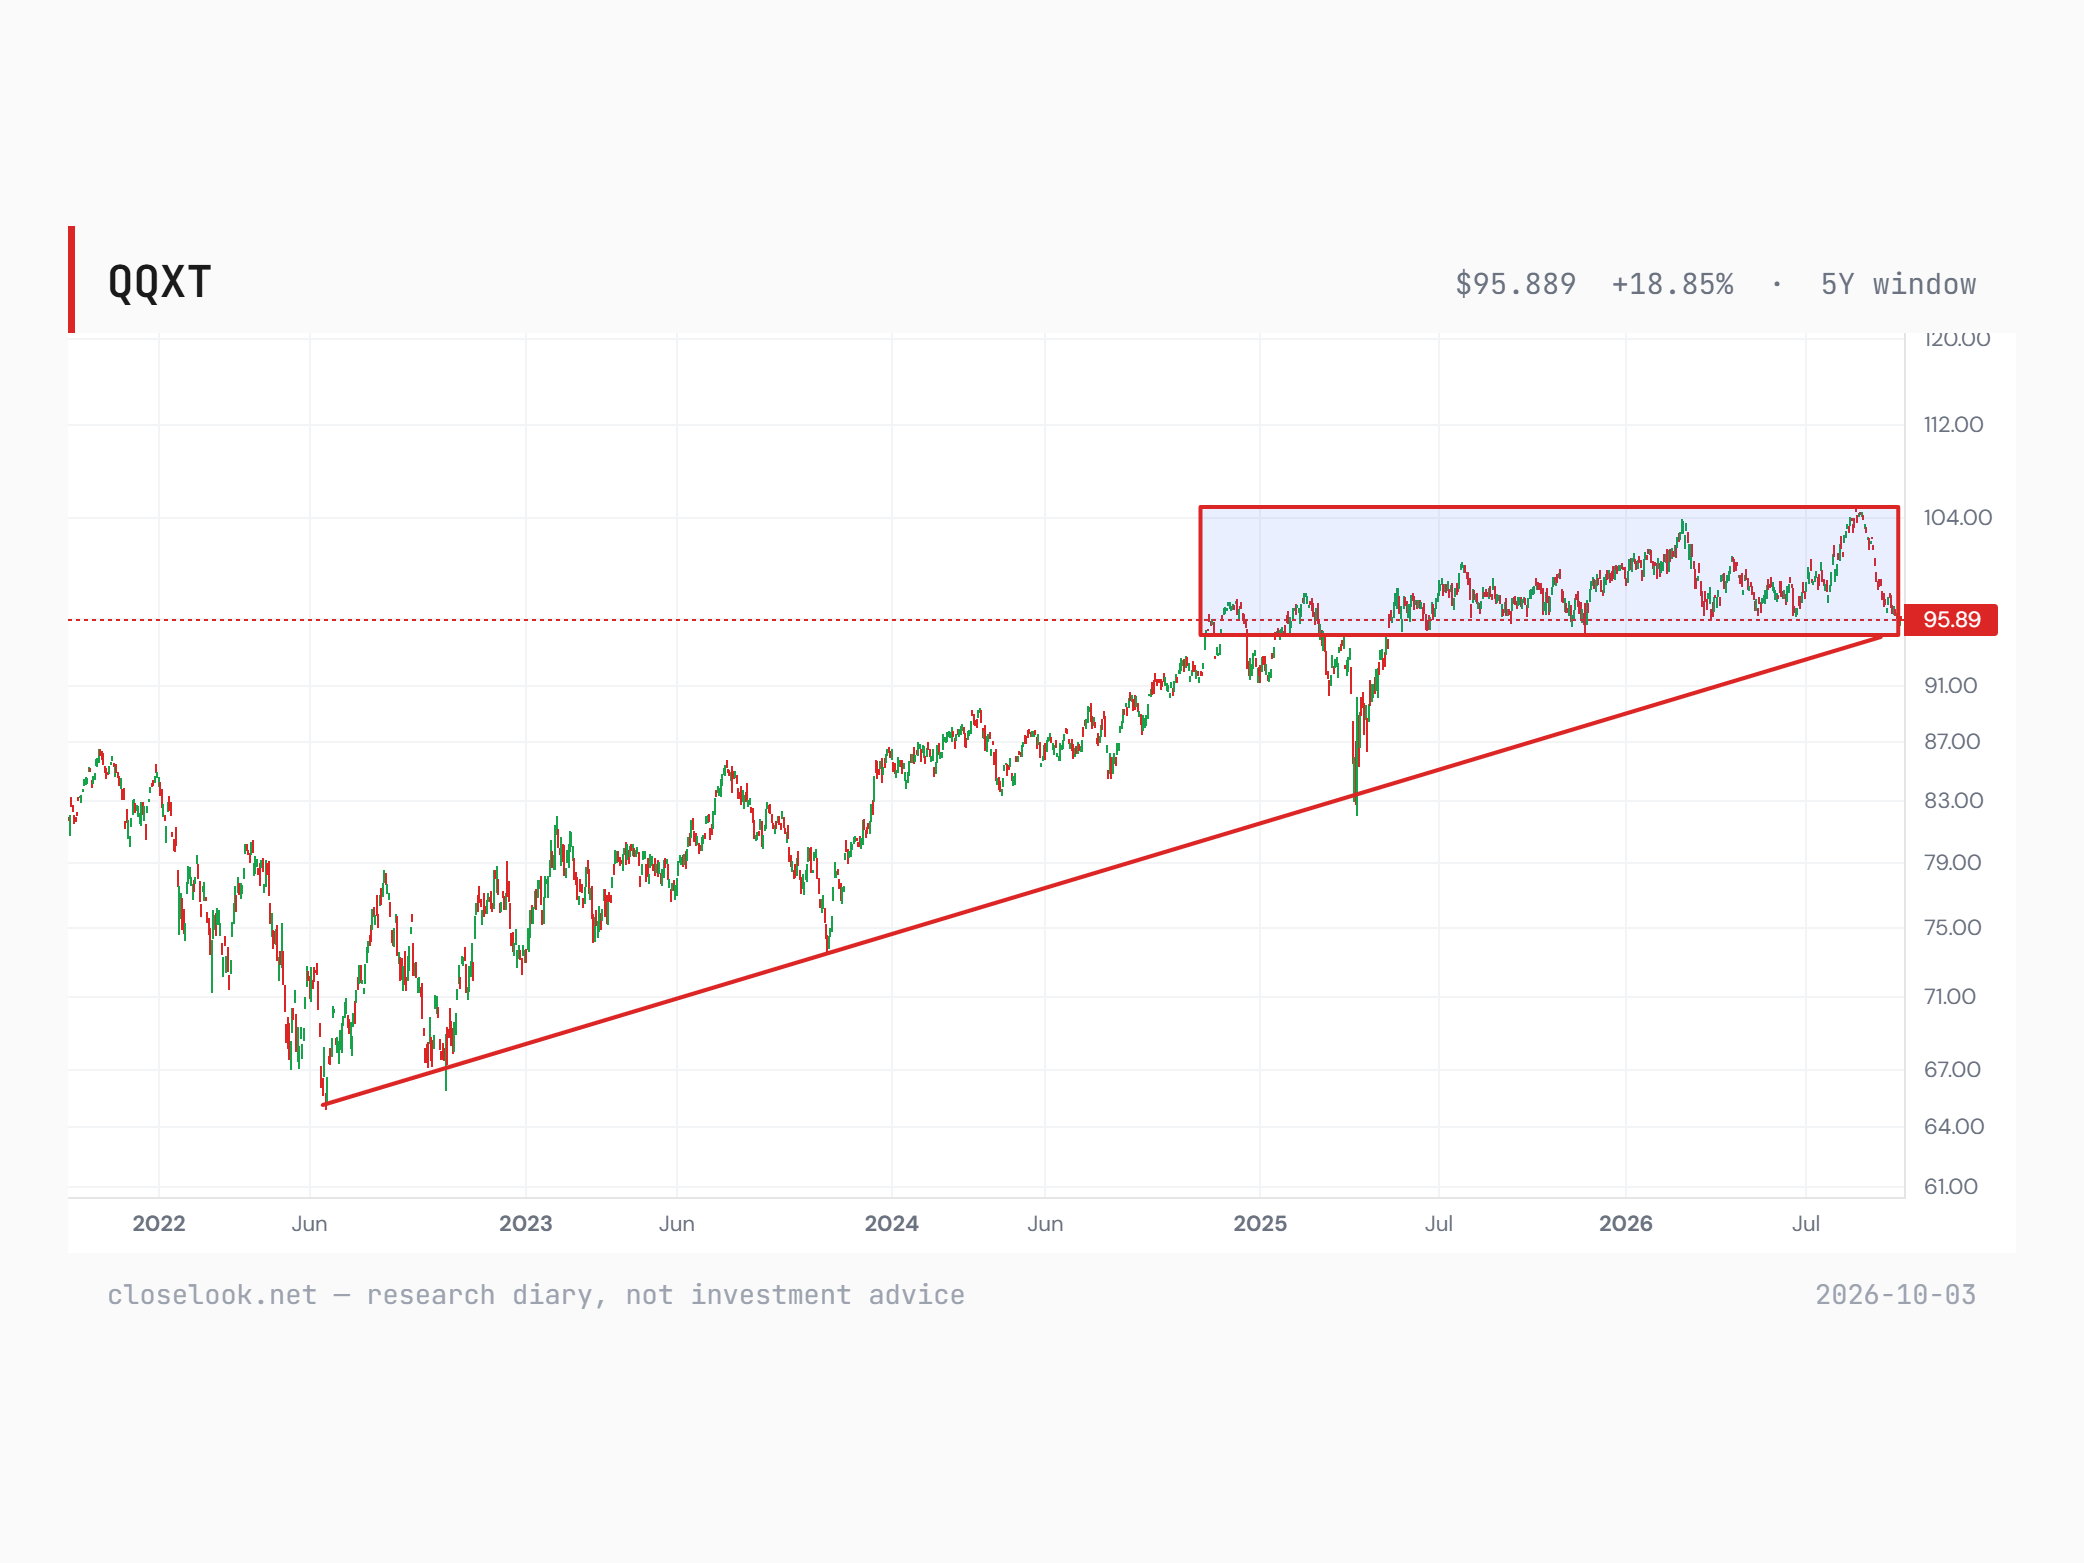
The editor's read on the non-tech half — sitting on support, and very critical. Two drawings of the same five years, and they agree on the one thing that matters: this is the line. Drawn from the October 2023 low, the rising line of the non-tech Nasdaq's bull market broke in September — the fund fell through it from its August high near 104 and closed the week at 95.89, also just under the 96.2 shelf that has caught every pullback since the middle of 2025, with 103–104 the ceiling above. Drawn from the June 2022 low through the October 2023 and April 2025 lows, the longer line is still intact, and the fund is sitting on it — the bull market that began in 2022 is not over on that reading, but it has no room left. Either way the non-tech half of the Nasdaq 100 is at the place where a three-year advance either holds or ends. The editor's rectangle adds the time: since the autumn of 2024 — the fund first closed at this level on 6 November 2024, at 95.97 — it has gone sideways in a box between about 95 and 104: two years of dead capital on the price (−0.1% since that first close), while the tech half of the same index rose 72% and the whole index 48%. A weekly close back above 96.2 says the shelf held; a weekly close under the long line from 2022 says the bull in what is not technology is over.
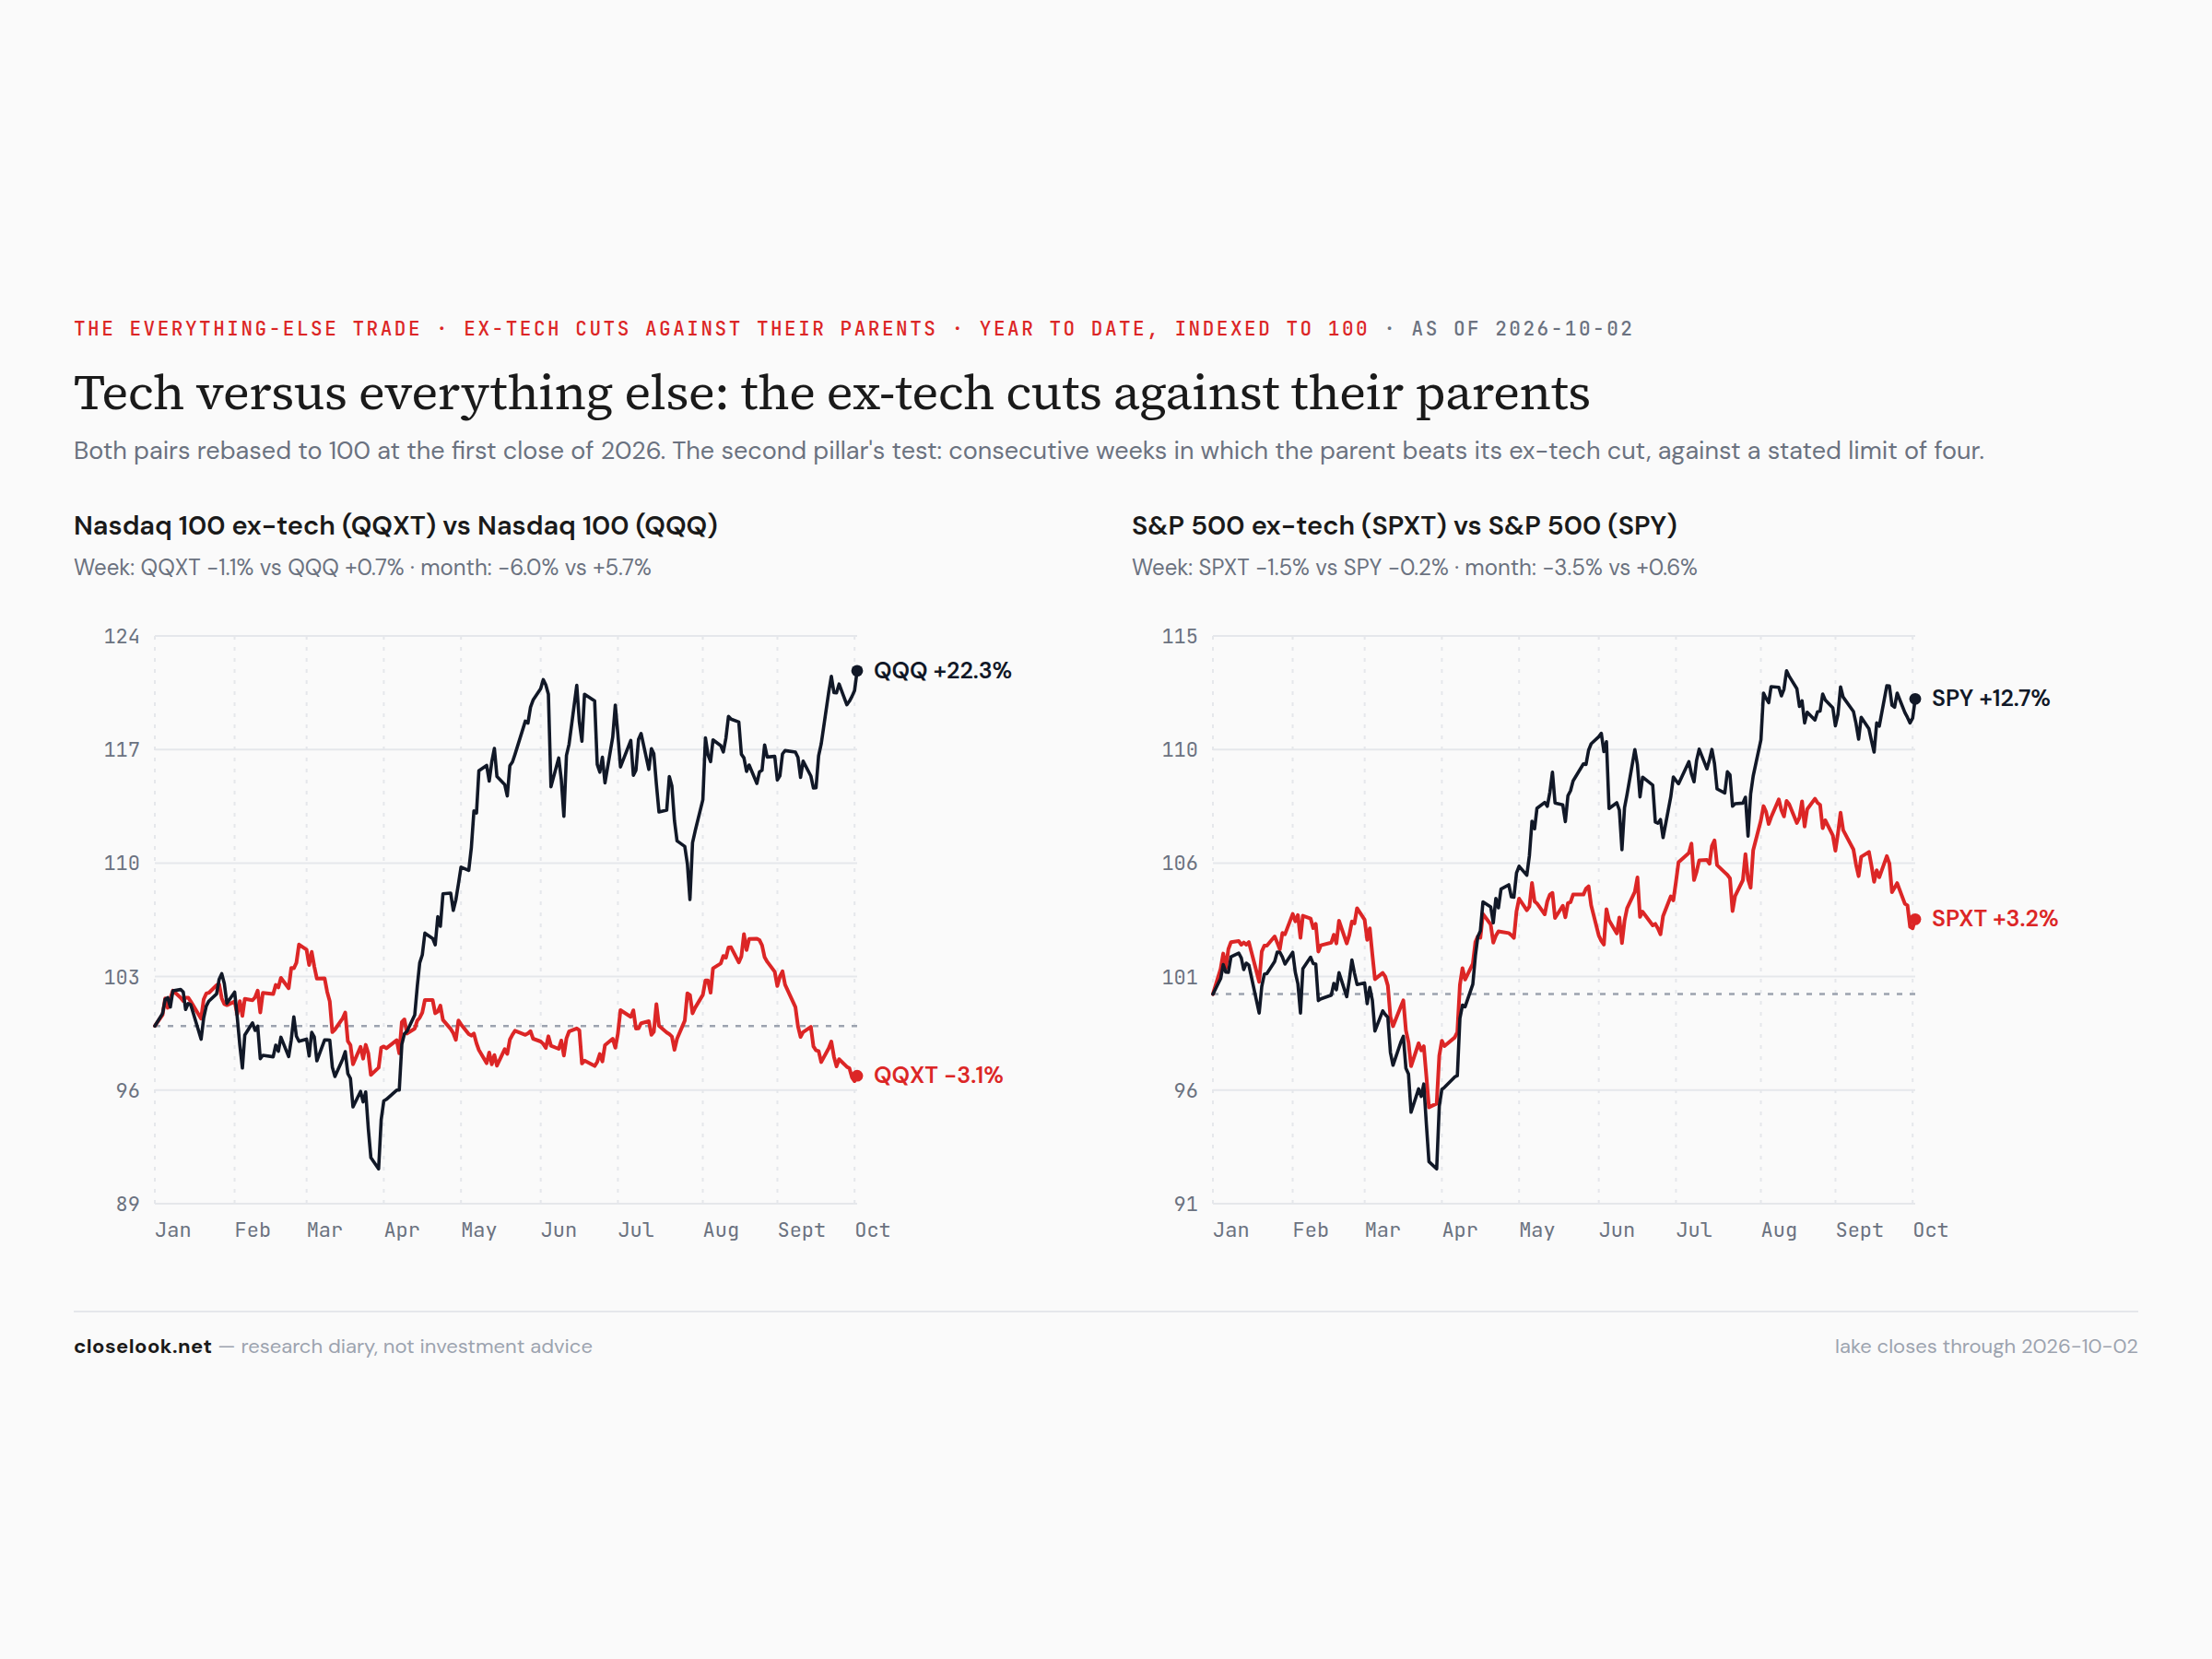
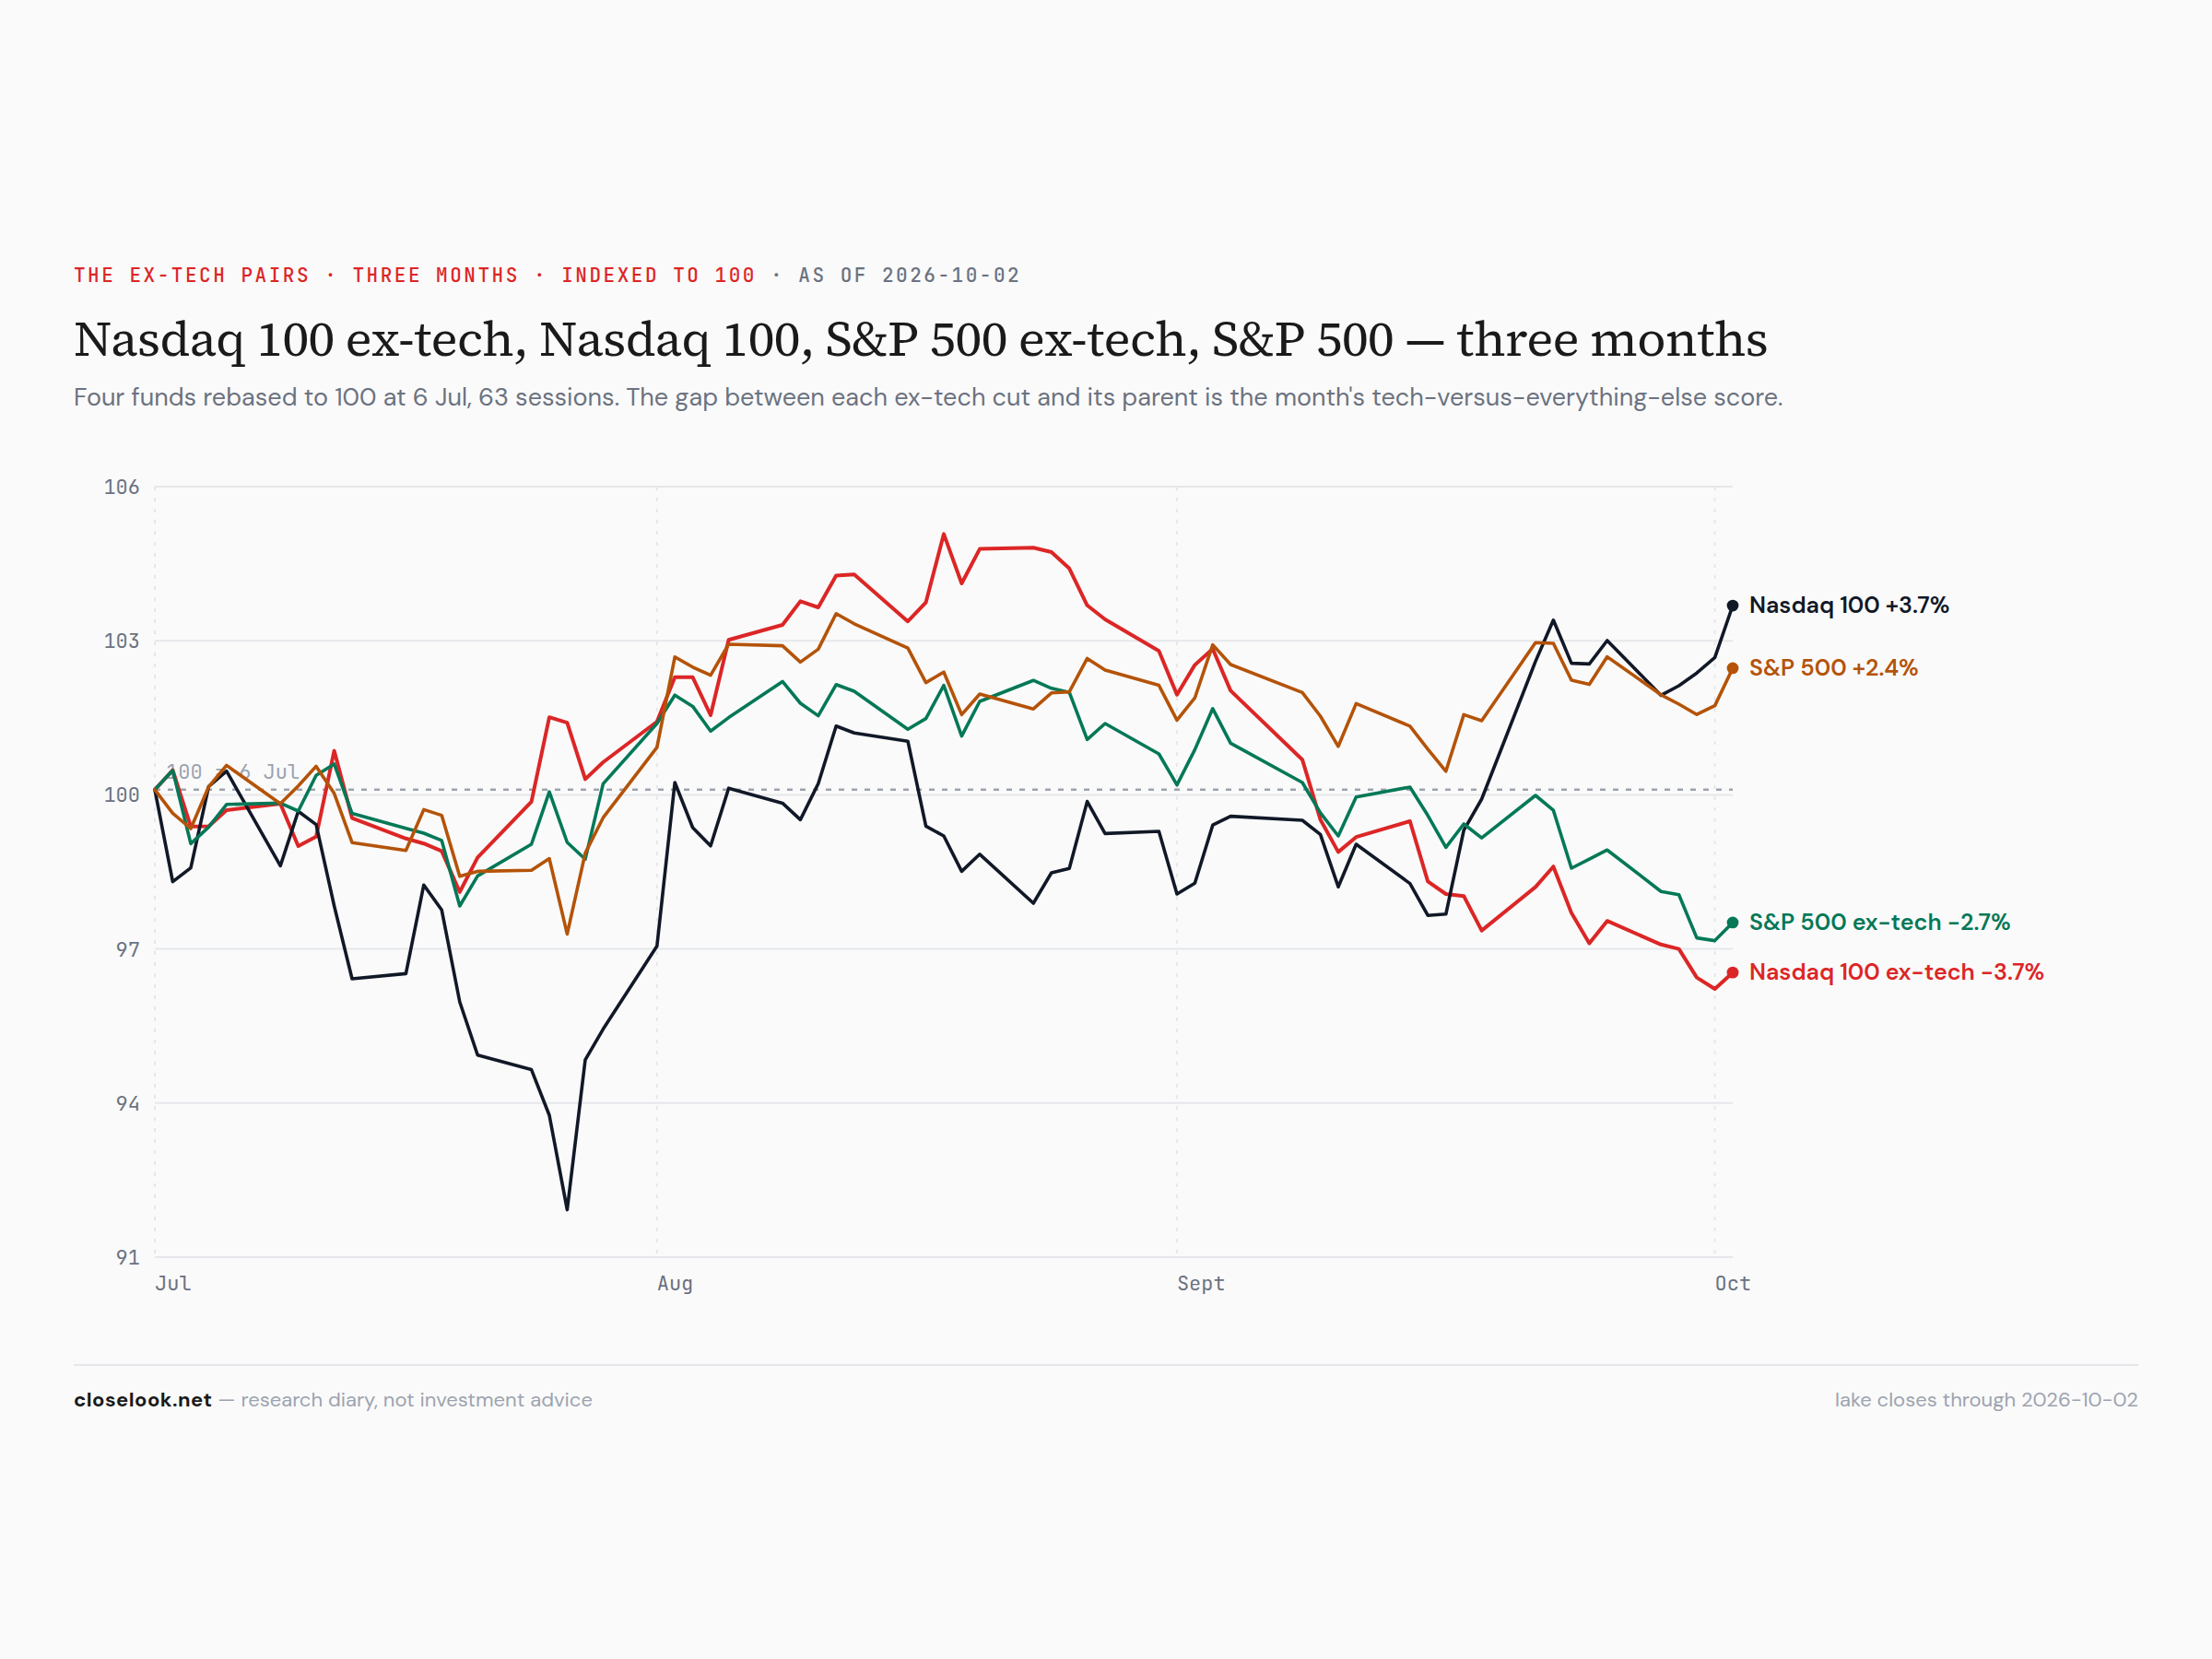
The ex-tech pairs. Over three months the four lines say the same thing at two altitudes: the Nasdaq 100 and its ex-tech half have moved apart, and so have the S&P and its ex-tech version. QQXT −3.5% on the year, SPXT +3.4%, the S&P +12.9%, the Nasdaq 100 +22.0%. What is not technology in America has gained between minus three and plus three percent in nine months.
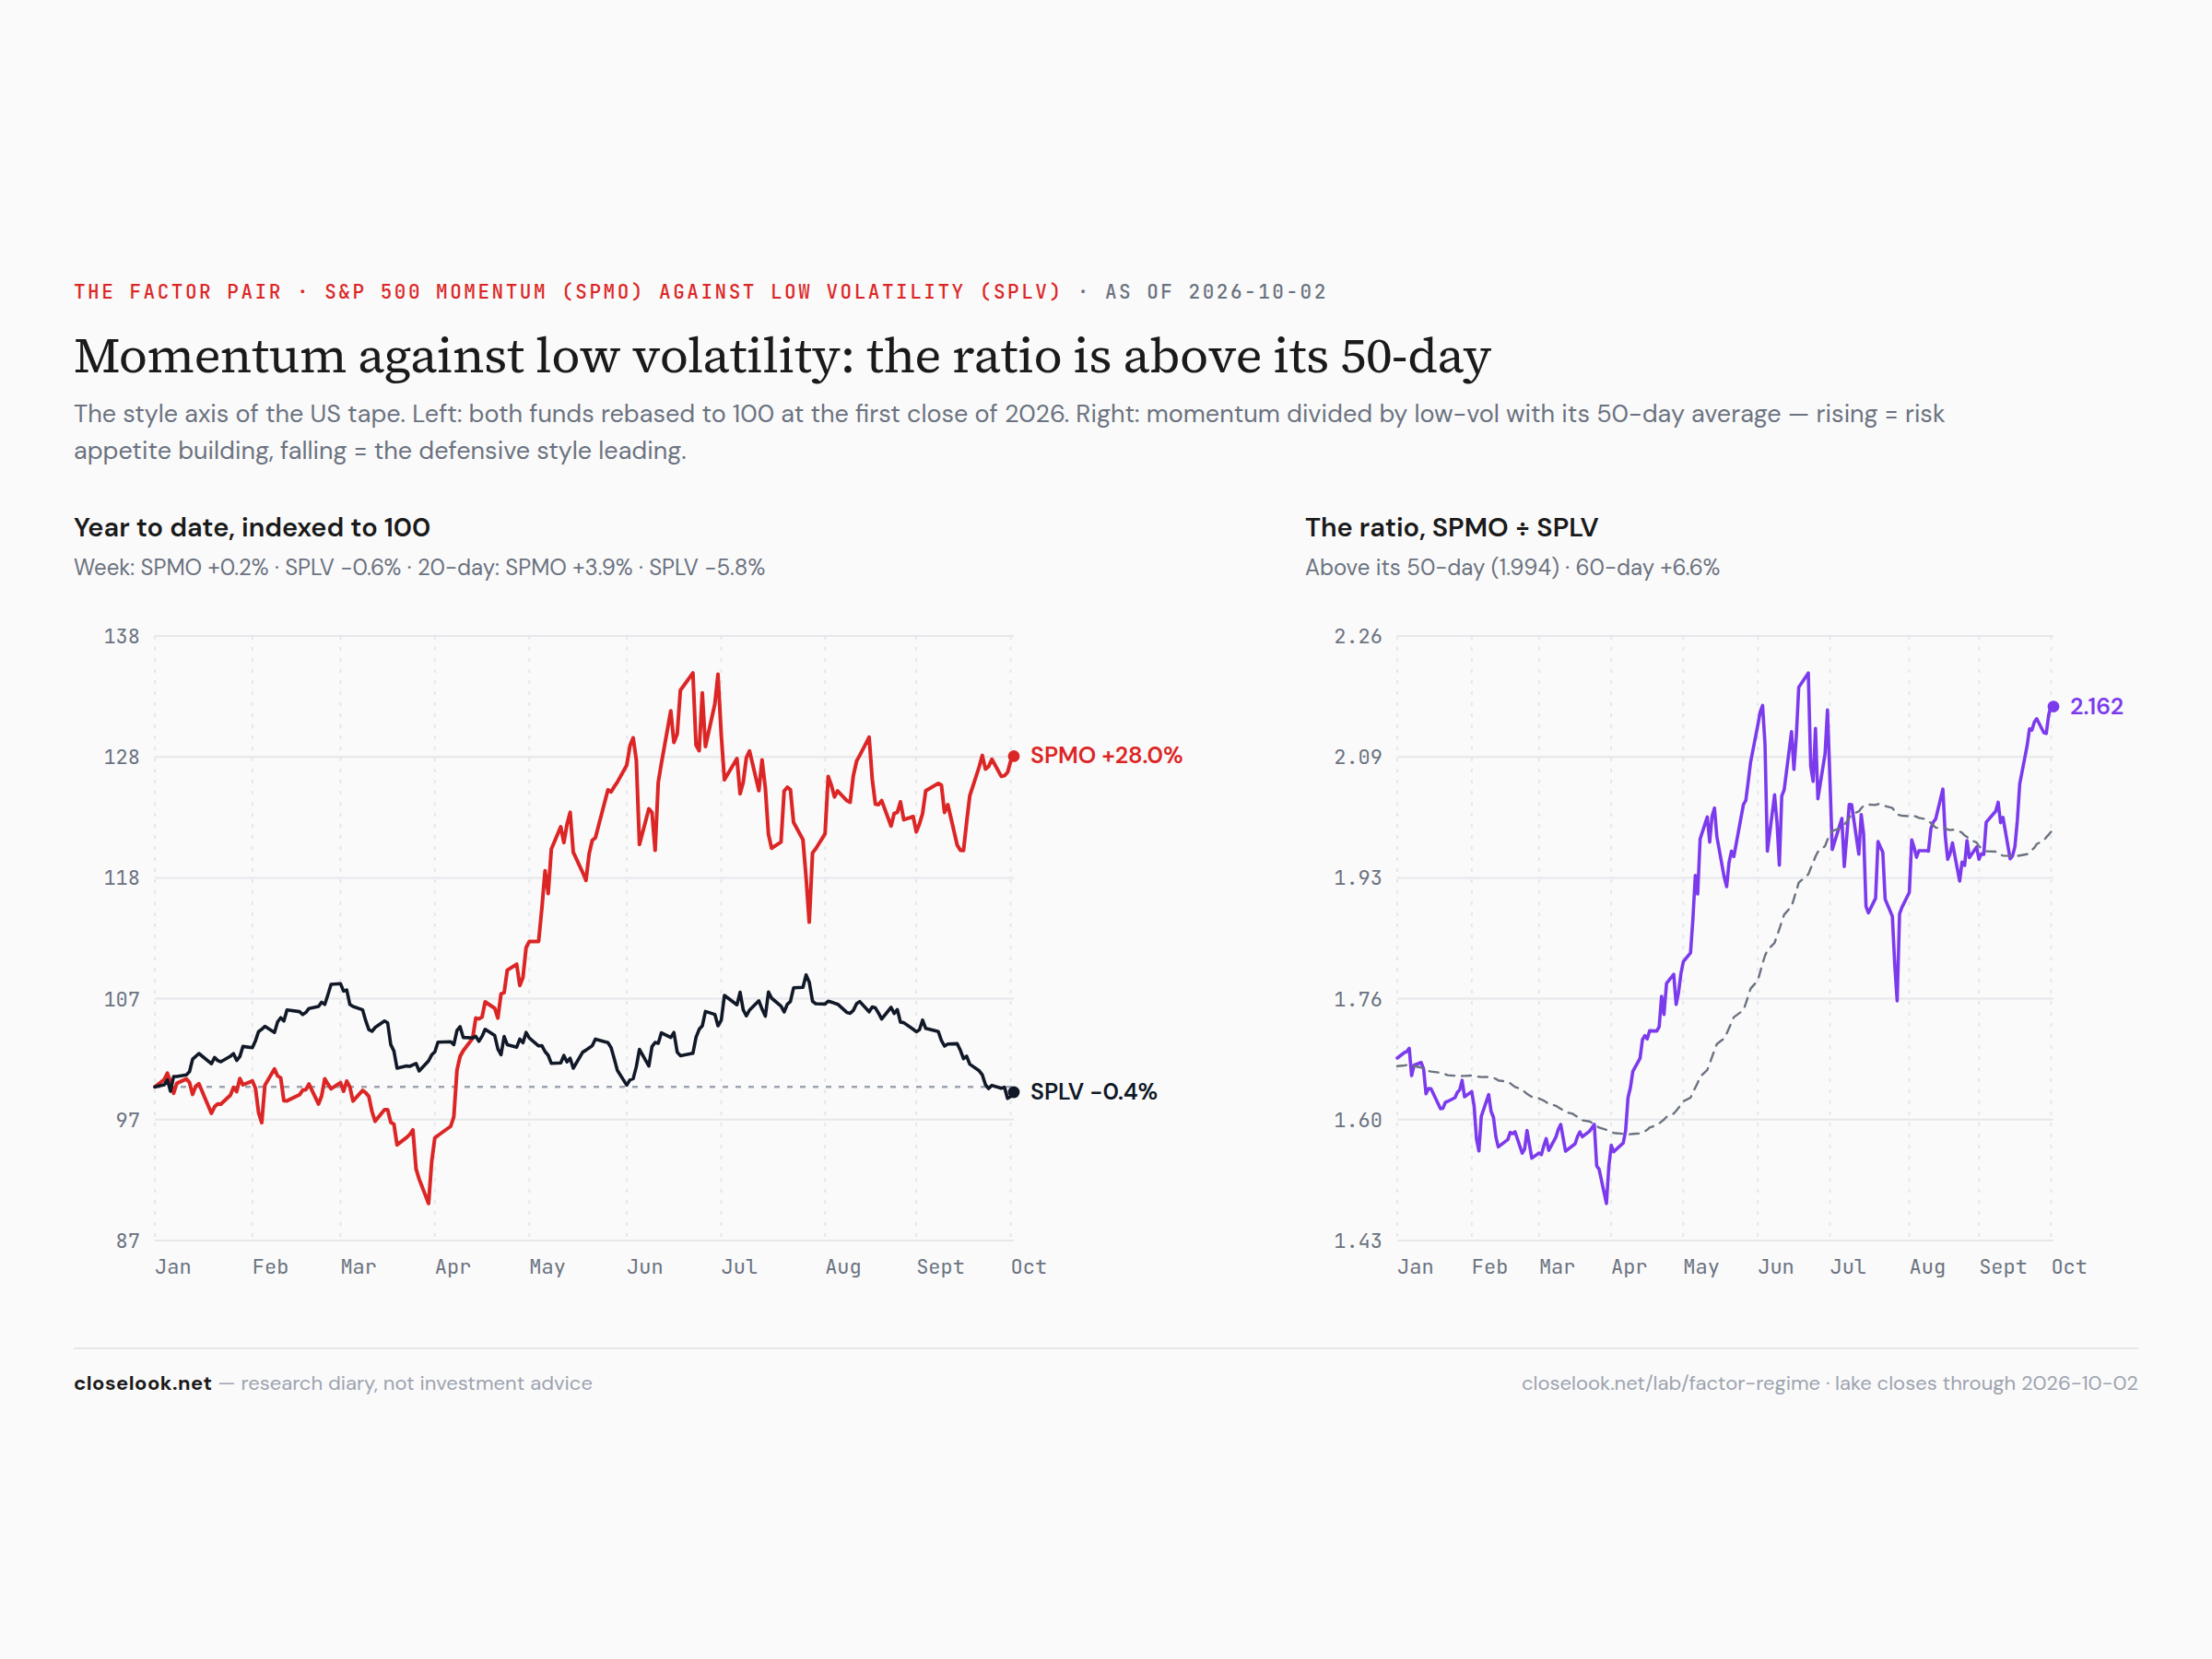
The factor pair — momentum at the top of its range. The momentum fund rose 0.20% to 153.23; the low-volatility fund fell 0.58% to 70.89. The ratio stands 8.4% above its 50-day average, in the 99th percentile of its range — the house factor gauge reads "momentum leading, risk appetite building". On the year momentum +28.4%, low volatility −0.7%. The low-volatility fund is full of the utilities, staples and banks; the momentum fund is full of what made the records.
The tech ETFs we carry
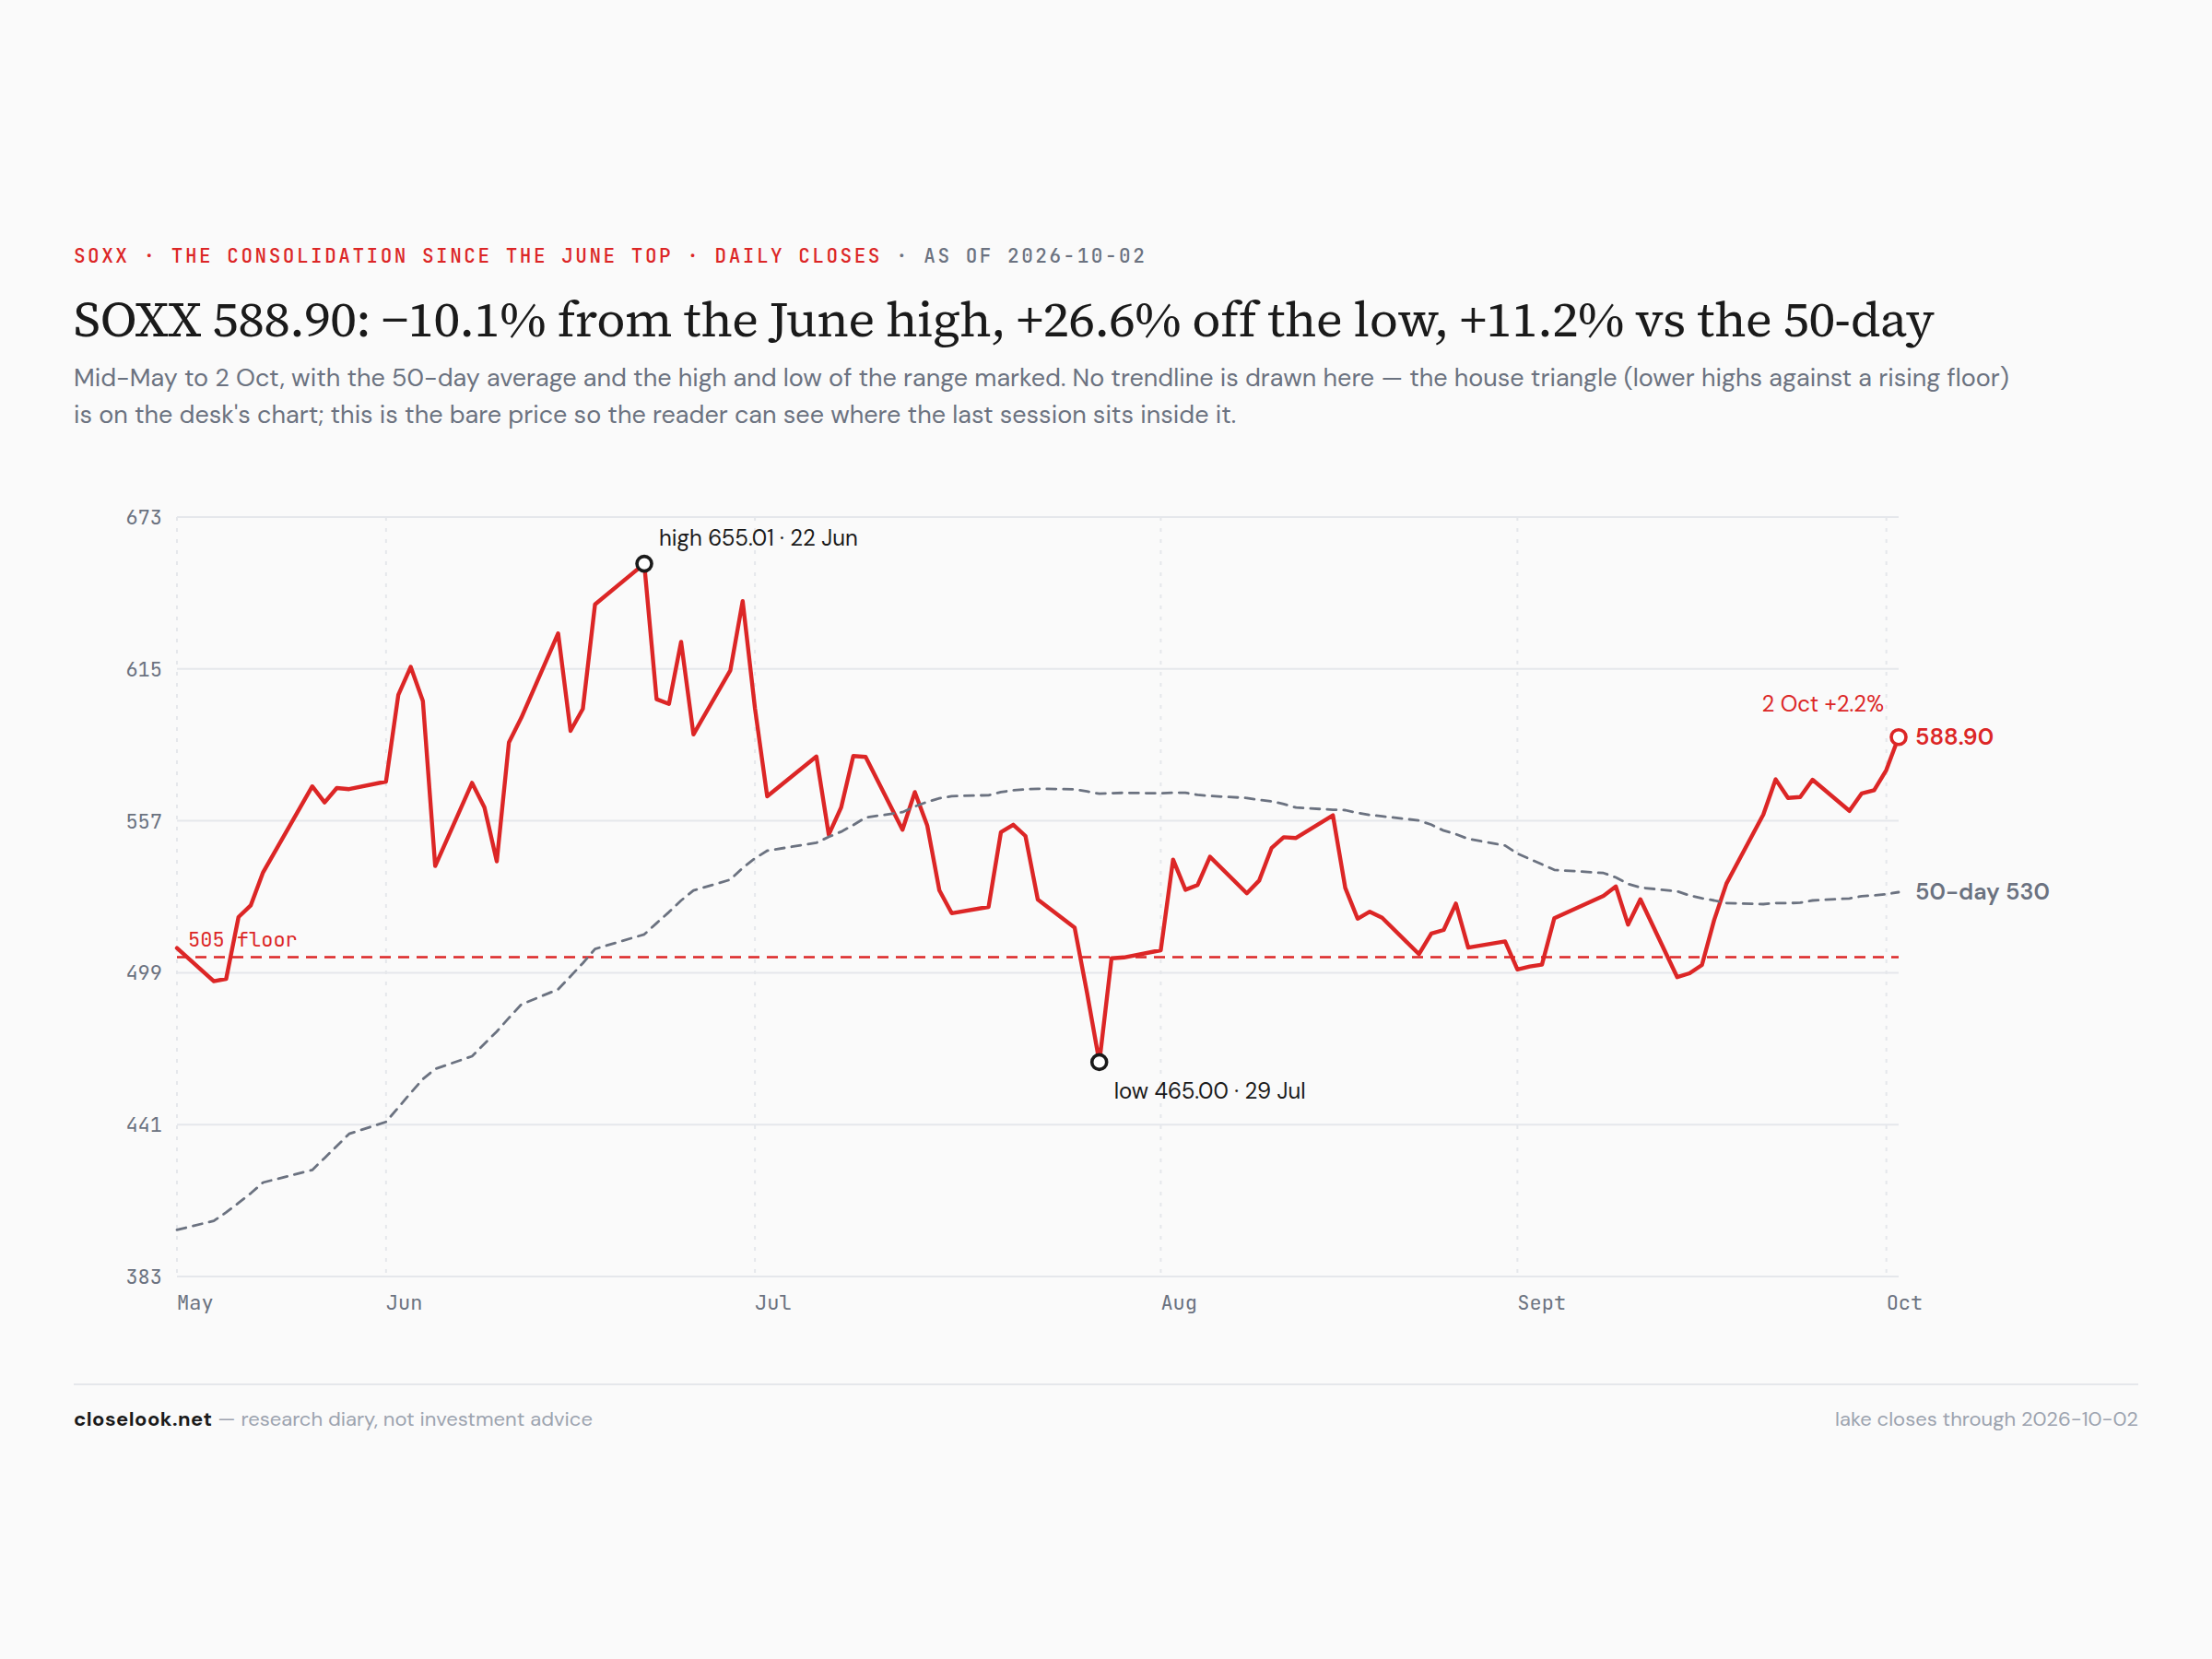
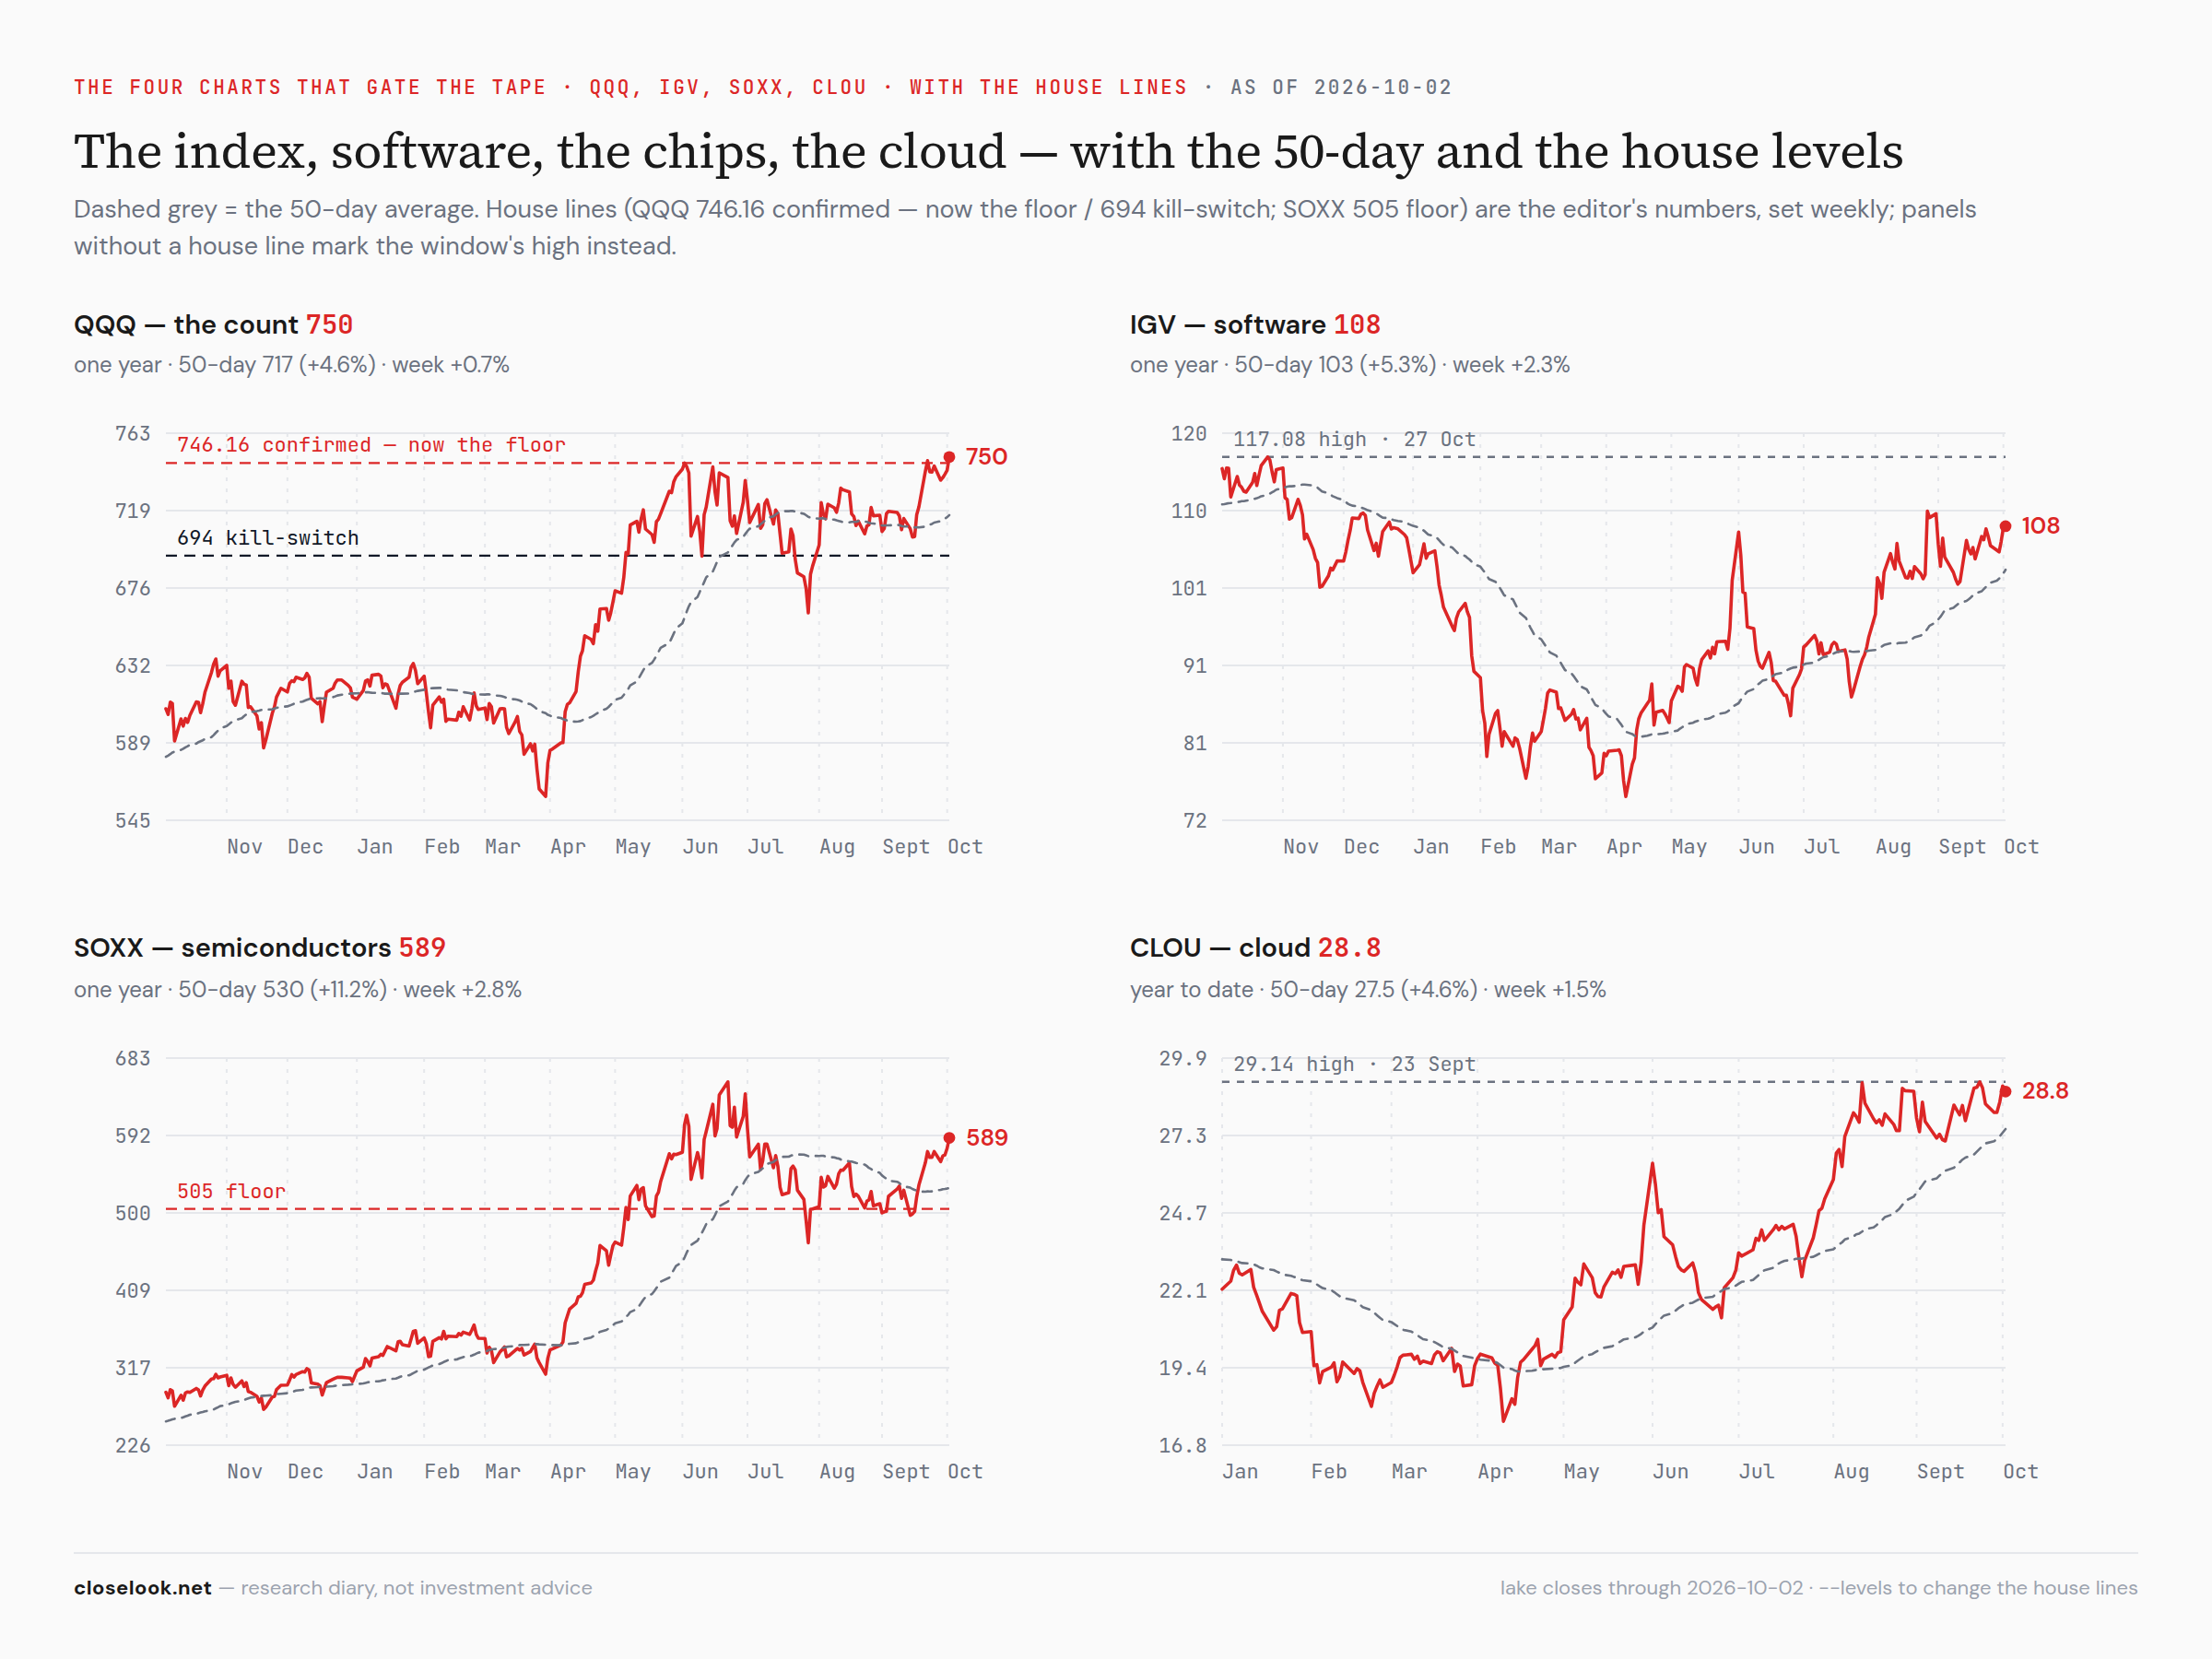
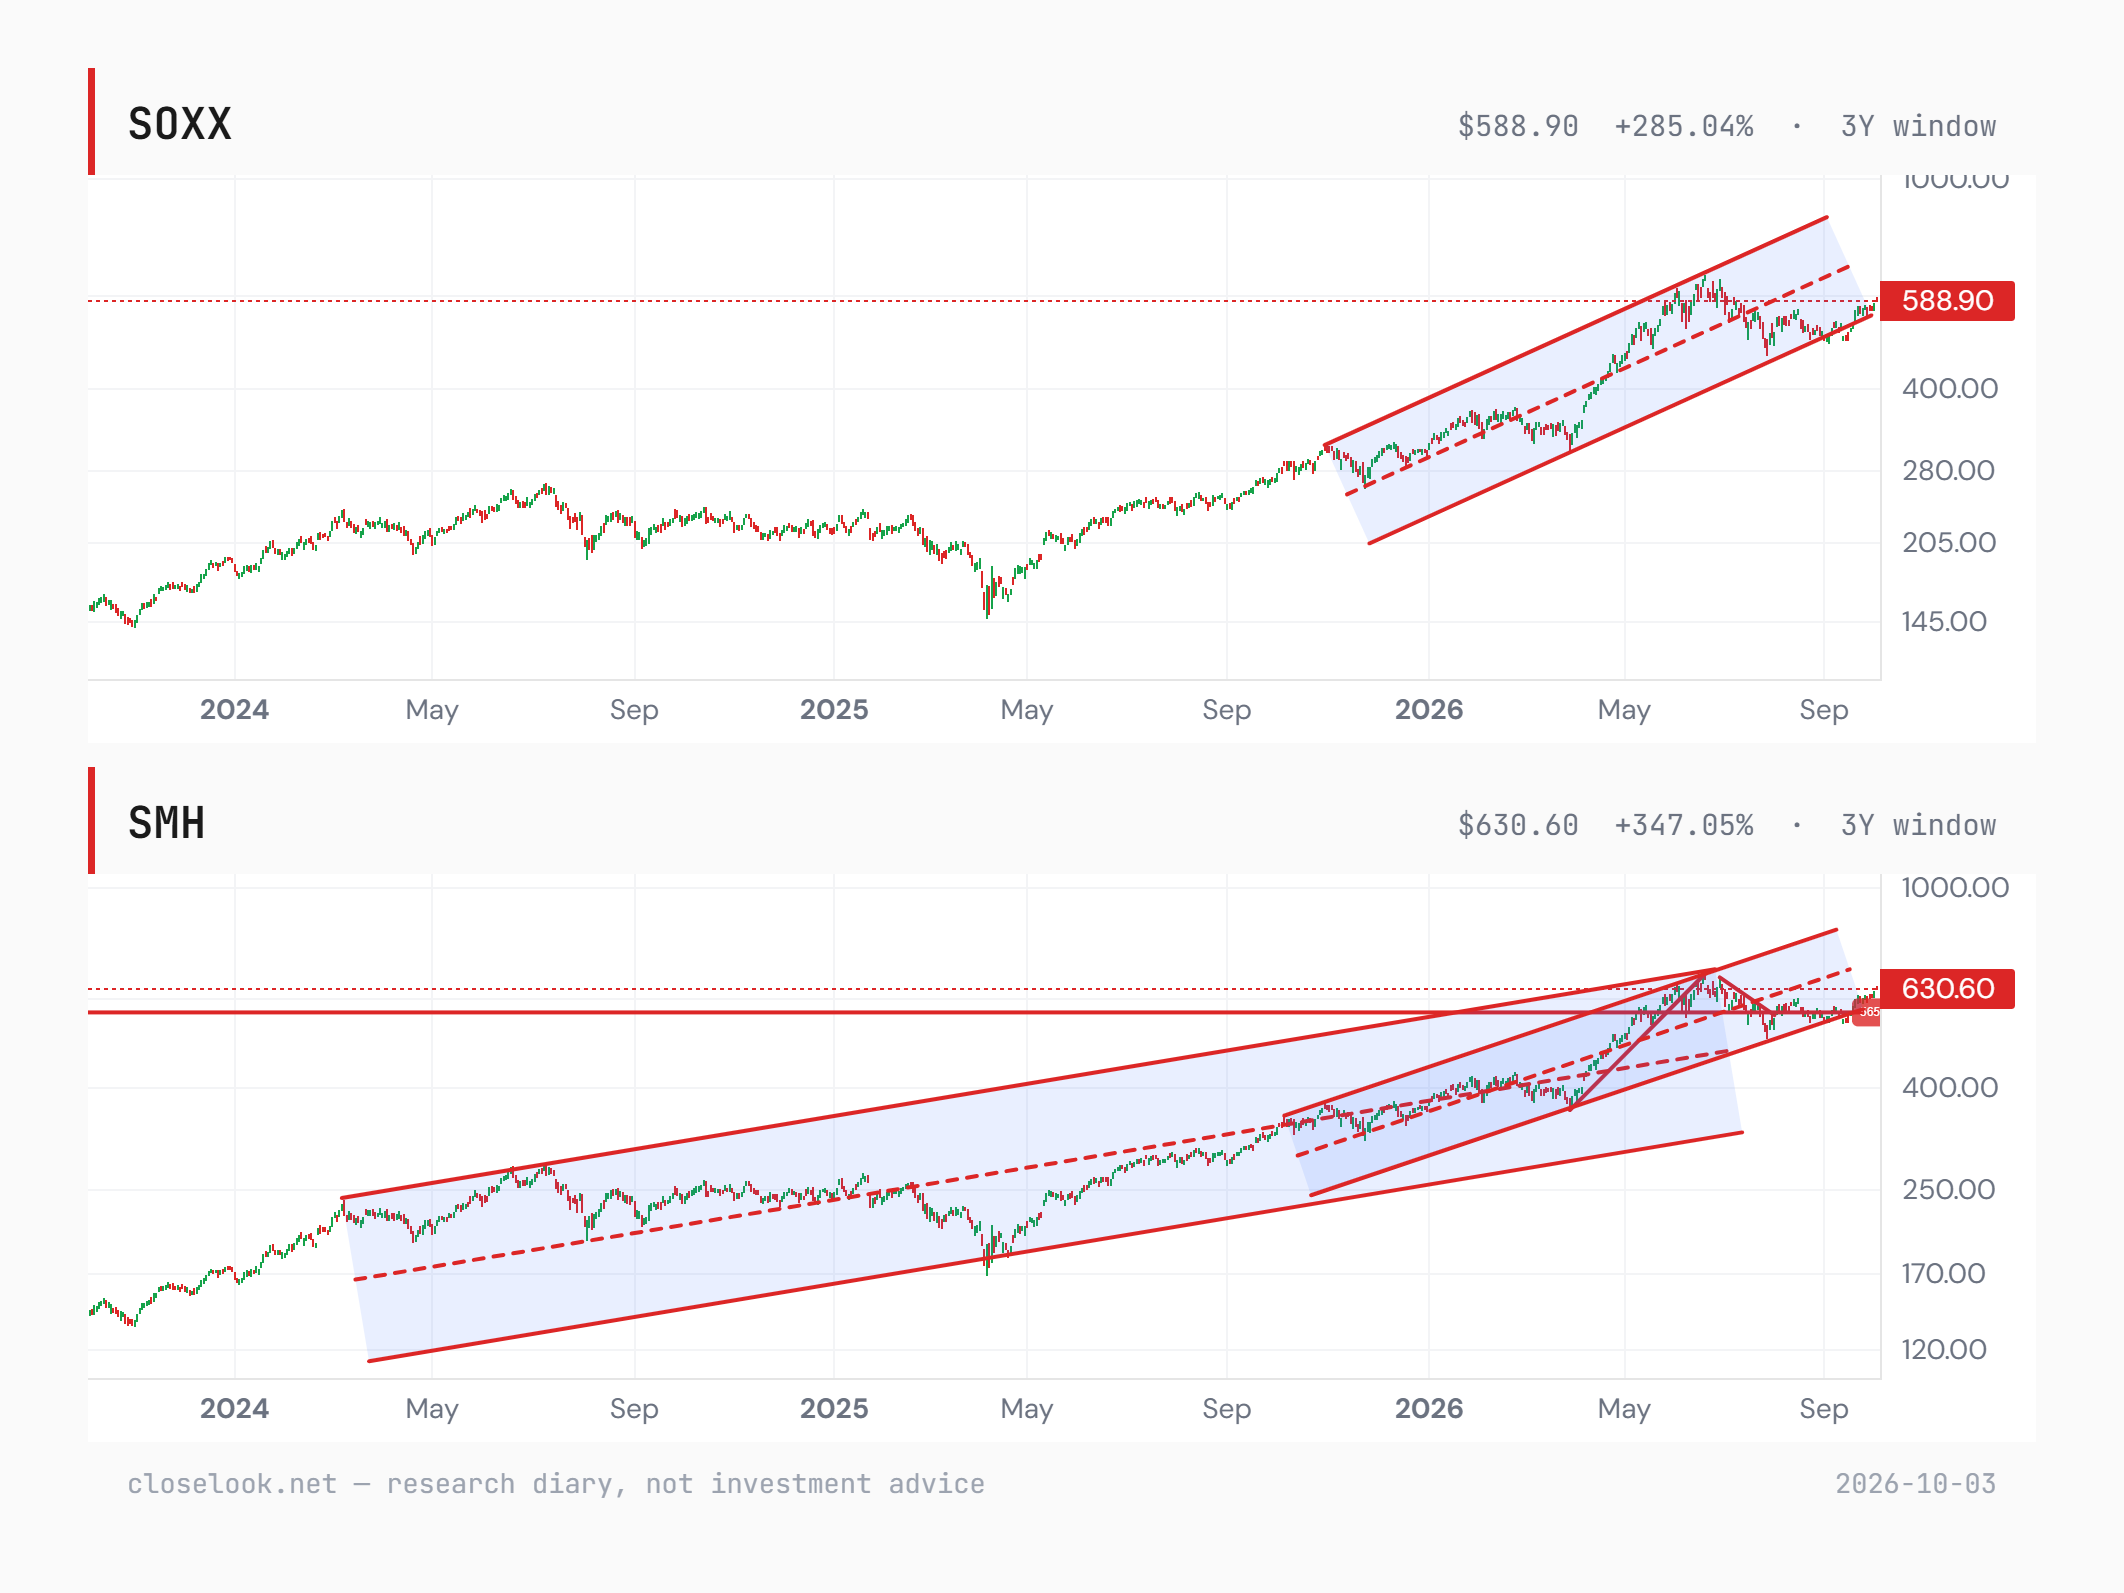
Fifteen of twenty-one green. The chip majors +3.96%, cybersecurity +3.71%, the WisdomTree AI fund +3.19%, the fabless fund +2.82%, the equal-weight semis +2.68%, software +2.28%, cloud +1.48%. The red six: digital transformation −6.37%, fintech −4.02%, uranium −2.87%, data centers −2.05%, defense tech −2.00%, ARK −1.04%. The chip index rose 2.83% to 588.90, the second up week in a row, and is 10.1% under its June 22 high; software closed 108.43, above the 105.69 year-end line for a second week and 1.7% under its August high.
| Symbol | Name | Last | 5D | 1M | 3M | 6M | YTD |
|---|---|---|---|---|---|---|---|
| SMH | VanEck Semiconductor | 630.6 | +3.96% | +14.55% | +6.47% | +60.74% | +75.10% |
| CIBR | First Nasdaq Cybersecurity | 104.7 | +3.71% | +11.93% | +15.47% | +63.11% | +46.54% |
| WTAI | WisdomTree Artificial Intellig | 45.35 | +3.19% | +13.83% | +6.53% | +56.81% | +55.63% |
| SMHX | VanEck Fabless Semiconductor | 63.22 | +2.82% | +15.18% | +7.79% | +65.88% | +66.24% |
| XSD | S&P Semiconductor | 555.21 | +2.68% | +16.37% | -0.12% | +64.94% | +72.64% |
| IGV | iShares Expanded Tech-Software | 108.43 | +2.28% | +4.84% | +15.88% | +34.96% | +2.59% |
| GRID | First NASDAQ Clean Edge Smart | 182.91 | +1.86% | +4.20% | -0.68% | +10.25% | +19.53% |
| BOTZ | Global X - Robotics & Artifici | 36.03 | +1.78% | +2.39% | -3.64% | +7.87% | -0.55% |
| QTUM | Defiance Quantum | 156.06 | +1.52% | +7.84% | +0.68% | +41.92% | +42.31% |
| CLOU | Global X - Cloud Computing | 28.81 | +1.48% | +4.99% | +24.07% | +44.85% | +27.37% |
| SNSR | Global X - Internet of Things | 50.28 | +1.41% | +7.45% | +3.84% | +33.73% | +36.04% |
| ESPO | VanEck Video Gaming and eSport | 97.55 | +1.28% | +1.39% | +6.11% | +8.05% | -5.85% |
| AIQ | Global X - Artificial Intellig | 66.23 | +0.39% | +4.99% | +7.08% | +40.11% | +30.22% |
| LIT | Global X - Lithium & Battery T | 69.28 | +0.38% | -6.71% | -9.47% | -6.59% | +6.81% |
| FDN | First Dow Jones Internet Index | 291.75 | +0.05% | +1.52% | +9.25% | +22.05% | +8.38% |
| ARKK | ARK Innovation | 89.83 | -1.04% | +7.72% | +10.56% | +31.02% | +16.78% |
| SHLD | Global X - Defense Tech | 60.23 | -2.00% | -4.56% | -5.83% | -18.56% | -7.04% |
| DTCR | Global X - Data Center & Digit | 27.27 | -2.05% | -0.62% | -4.18% | +10.85% | +29.24% |
| NLR | VanEck Uranium and Nuclear | 102.74 | -2.87% | -12.21% | -10.61% | -23.14% | -17.28% |
| FINX | Global X - FinTech | 24.34 | -4.02% | -9.19% | -4.81% | +5.96% | -17.30% |
| DAPP | VanEck Digital Transformation | 19.11 | -6.37% | +1.49% | +3.41% | +27.48% | +15.61% |
Sorted by Weighted Alpha (leaders → laggards) · Barchart, close of week.
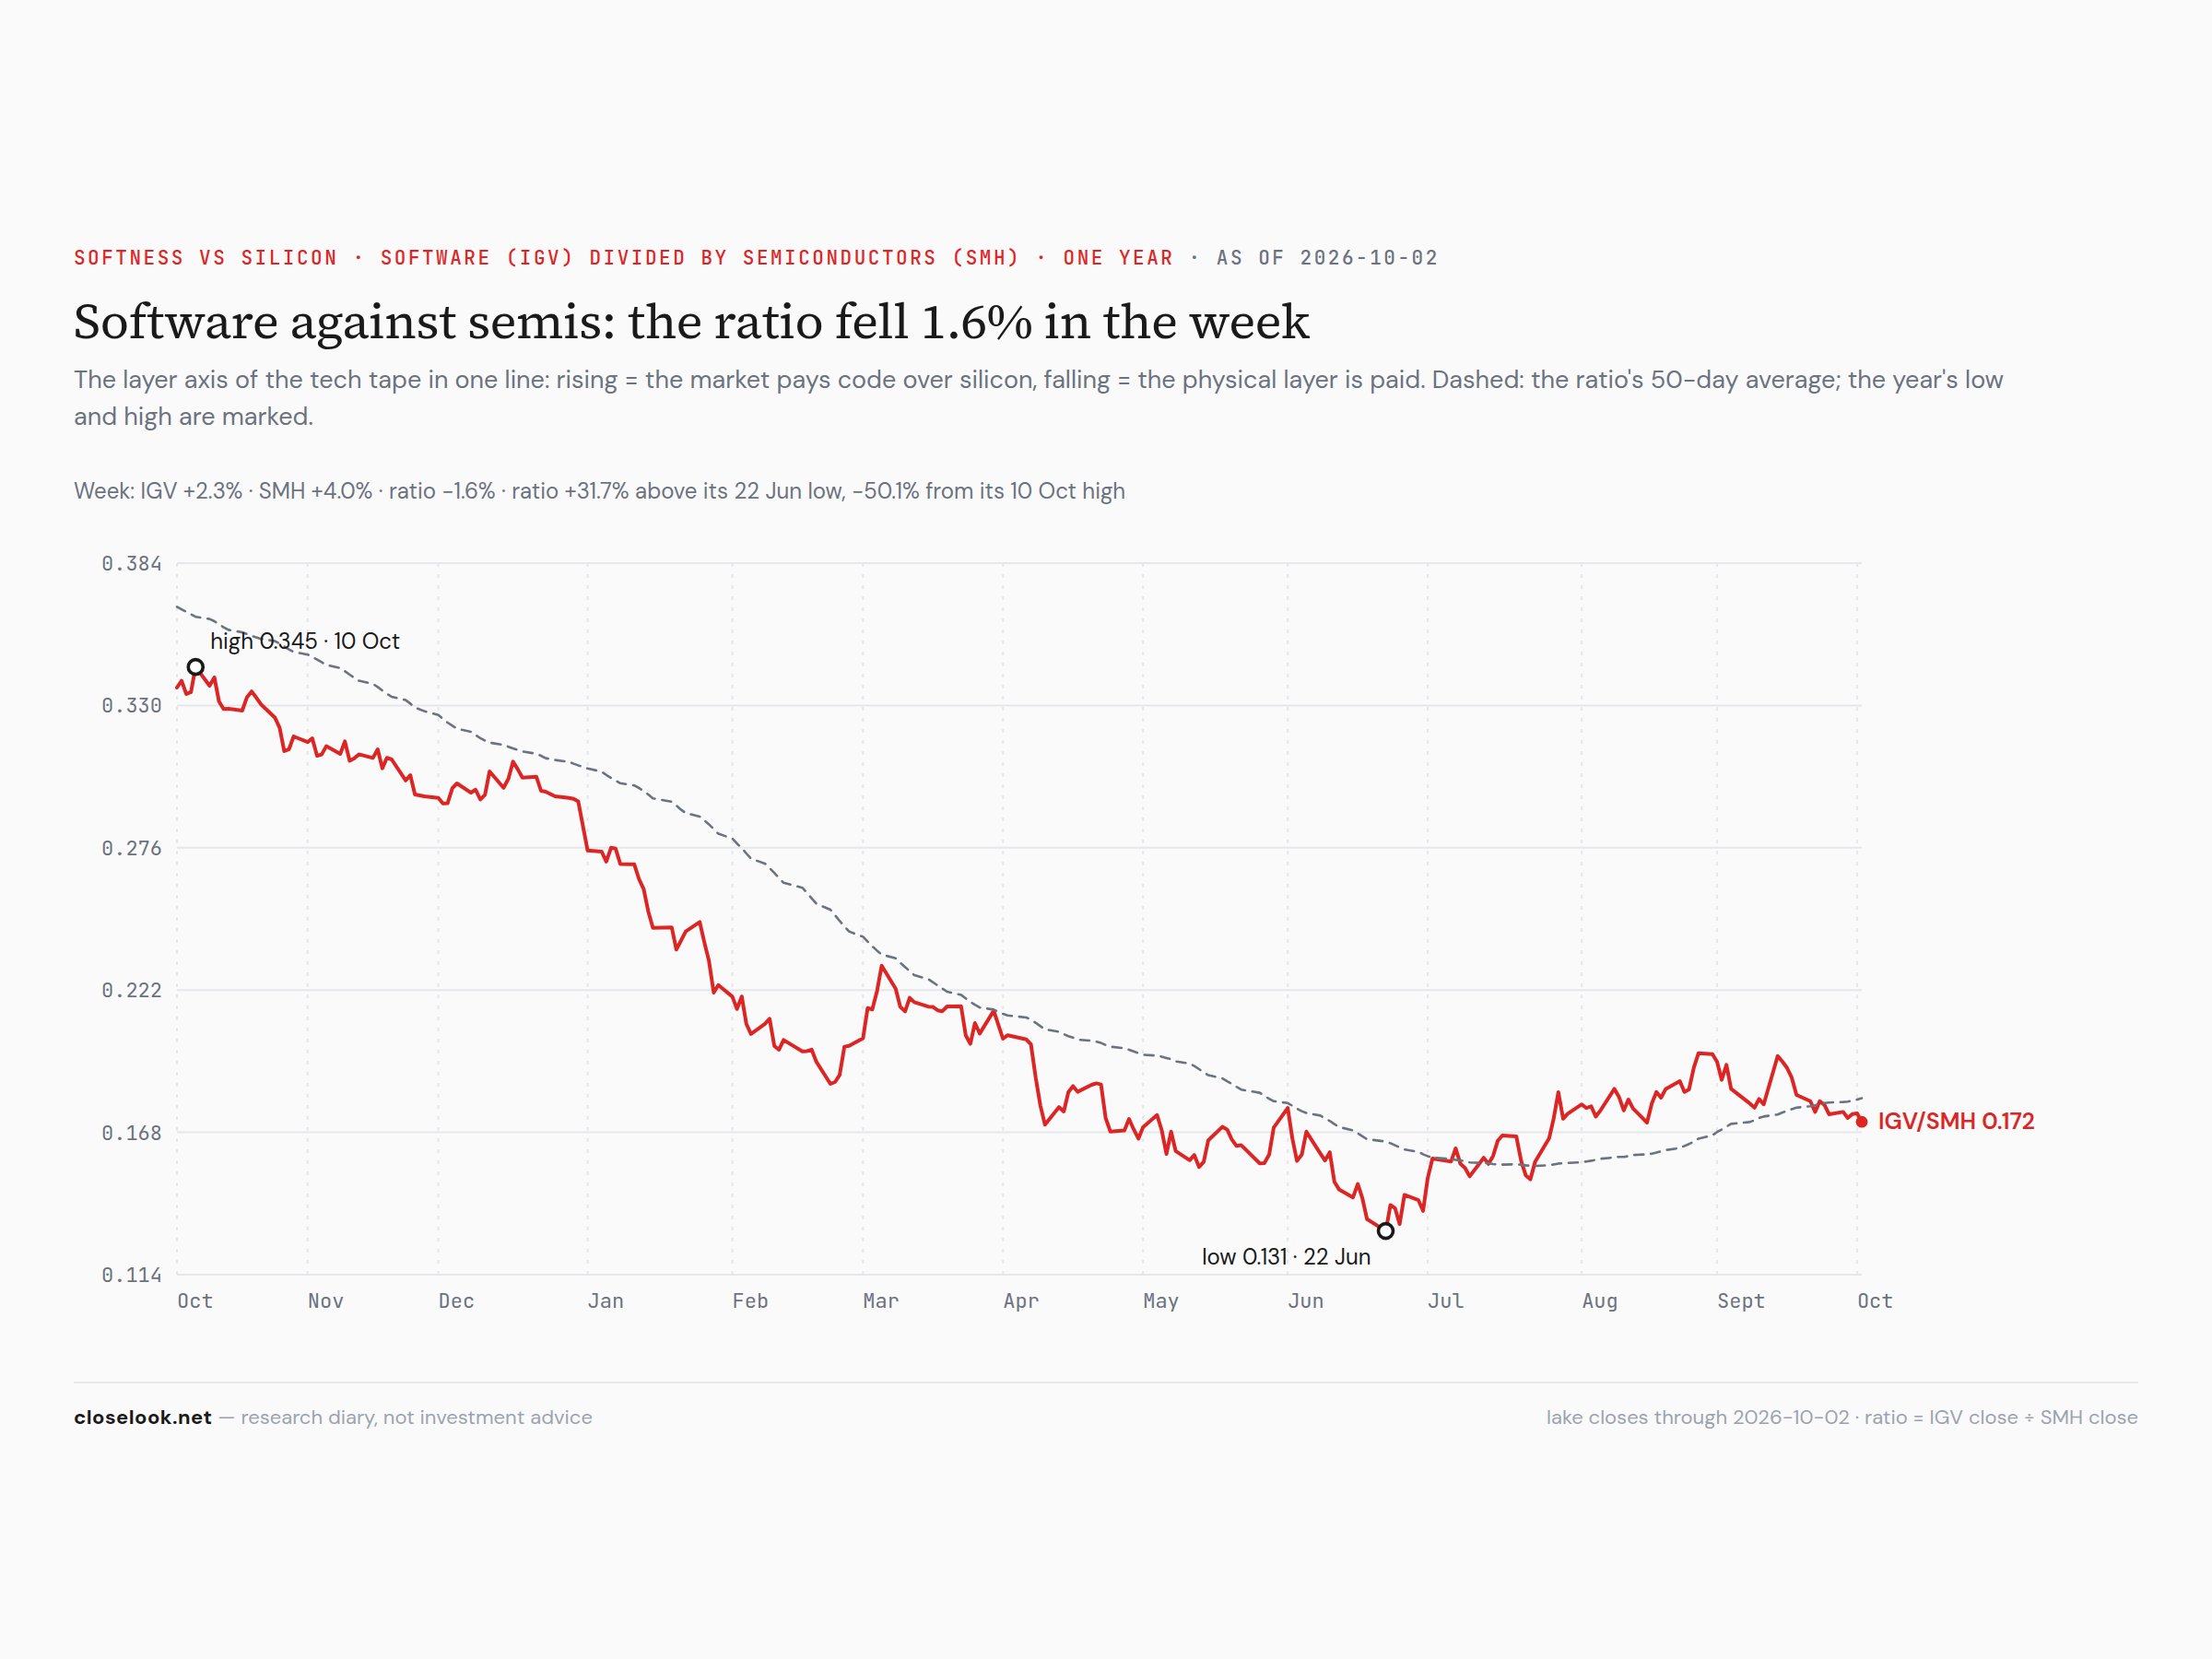
Software against silicon. The software-over-chips ratio fell 1.6% to 0.1719 on the week; it is 31.7% above its June low. Both halves rose this week, the chips more. The ratio has stopped going up; it has not started going down.
The four indices: Dow, S&P 500, Nasdaq 100, Russell 2000
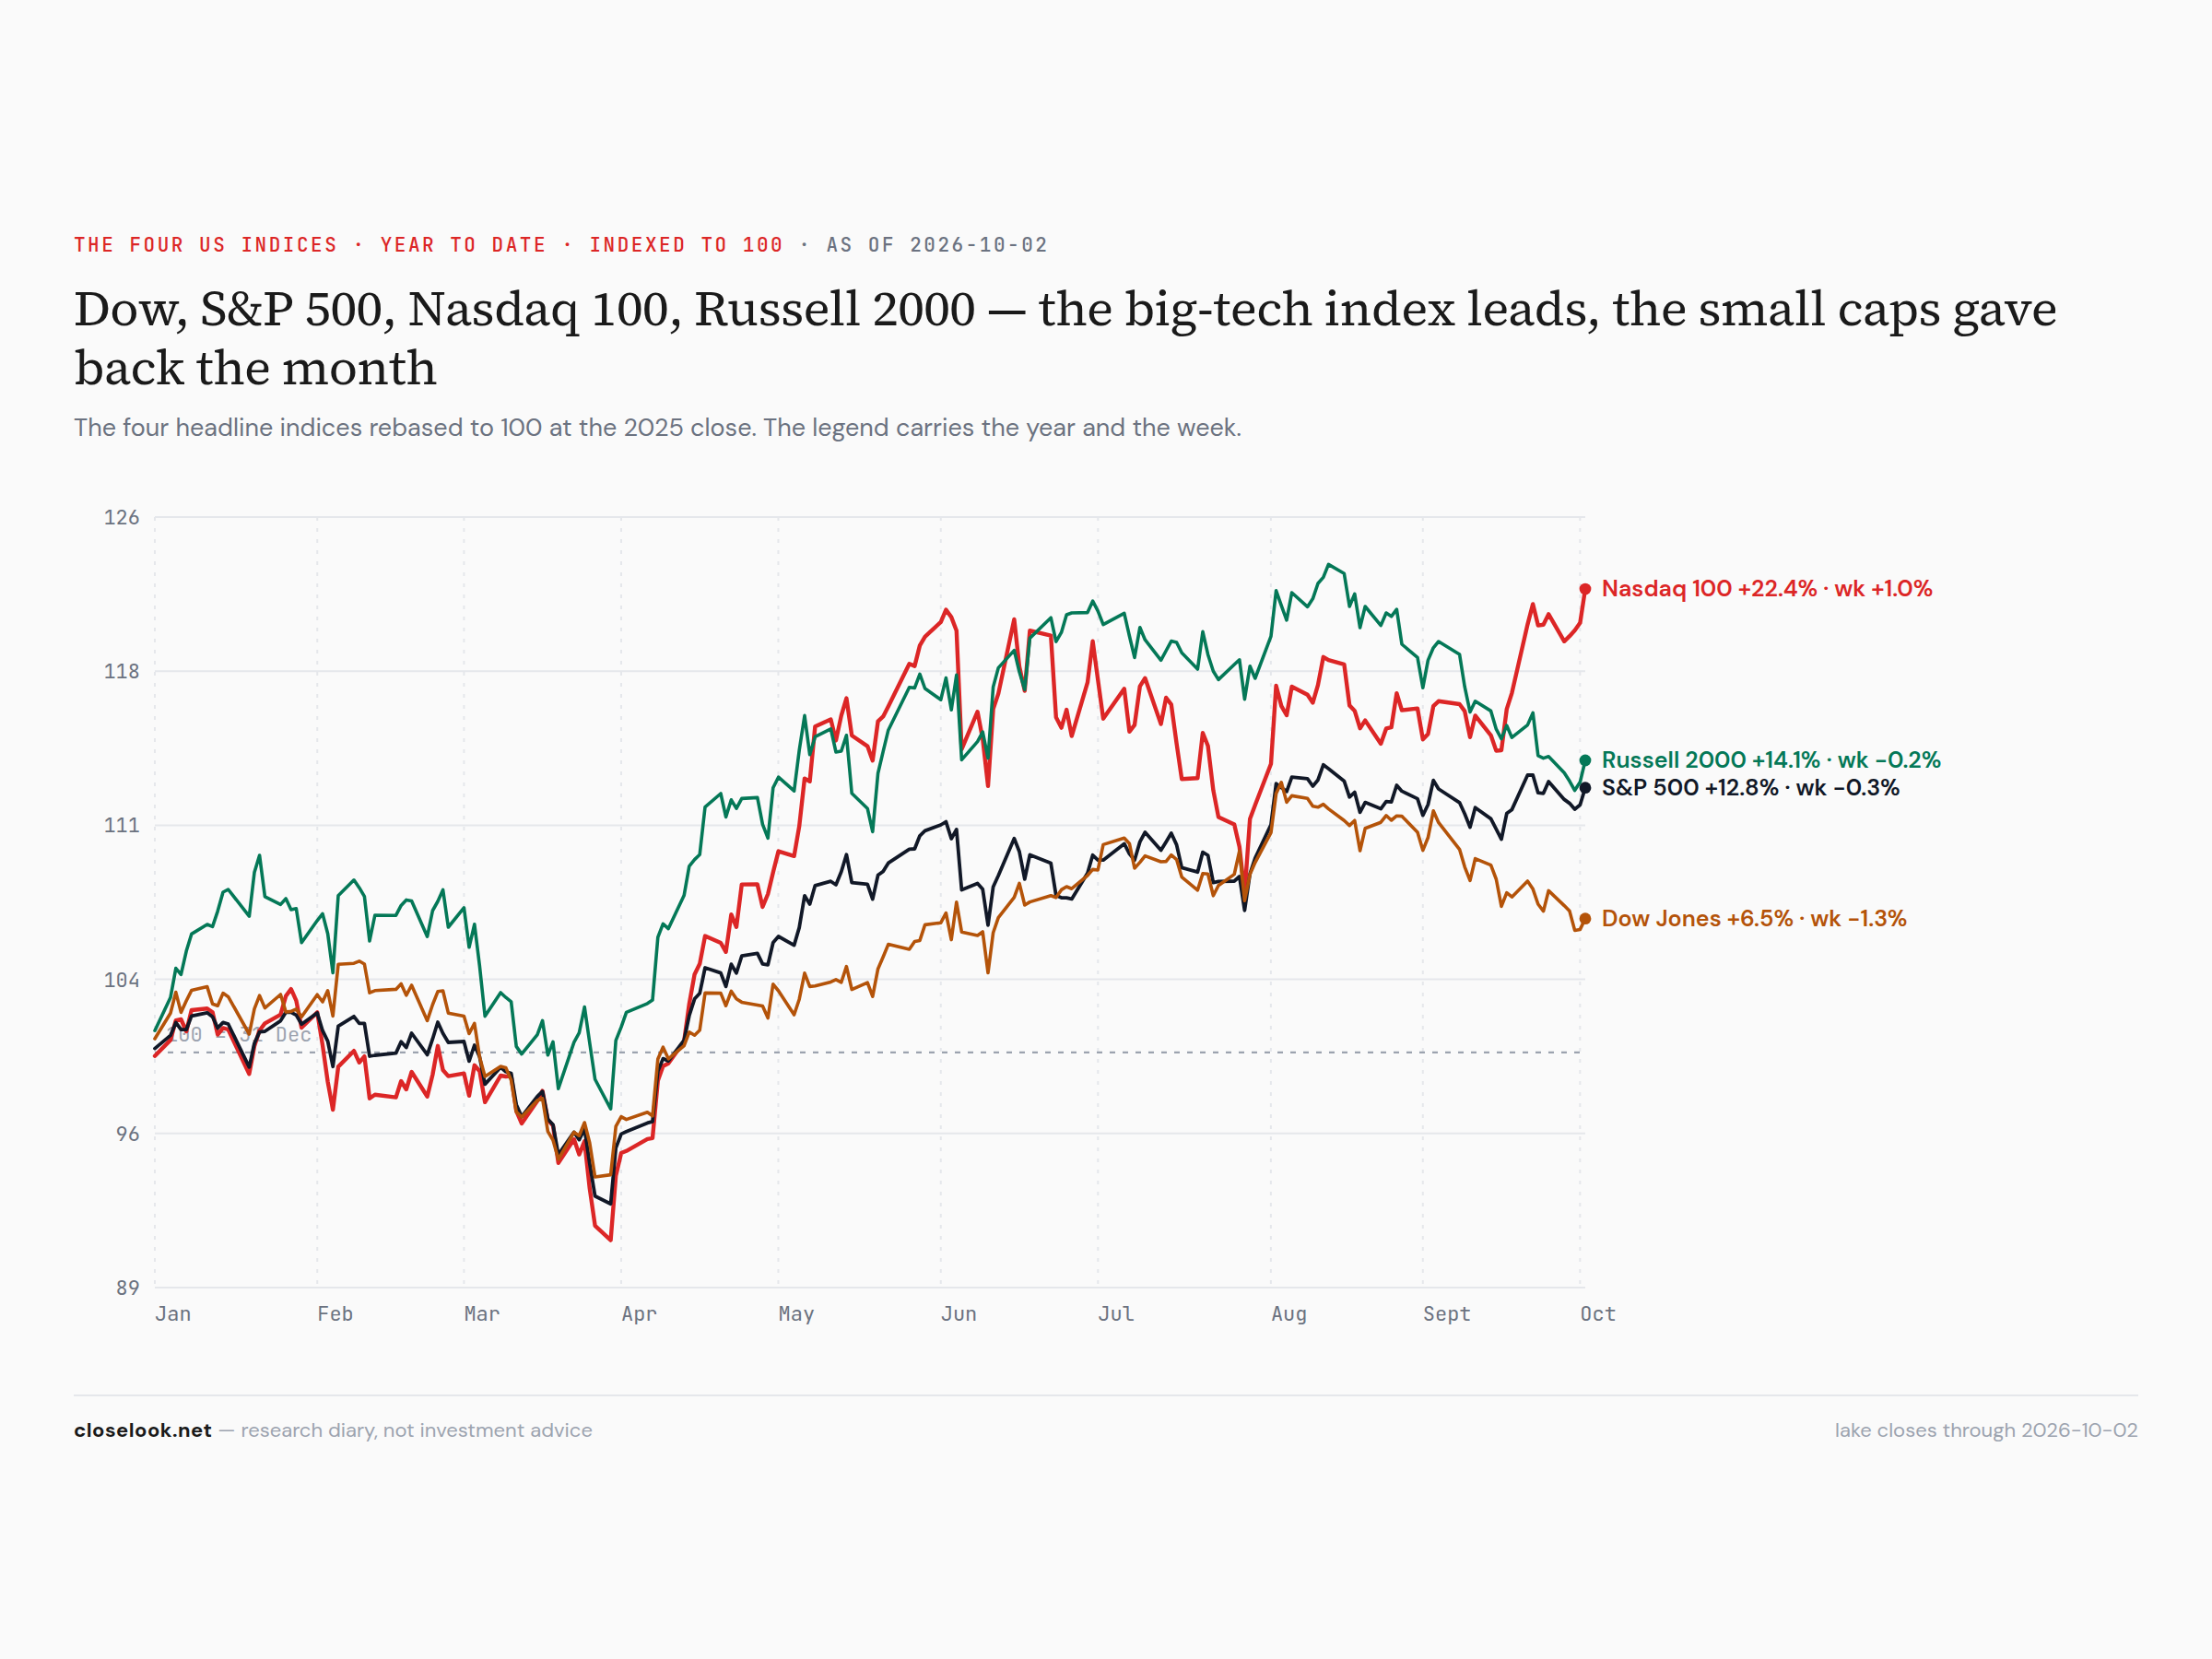
The Nasdaq 100 +1.0% to a record; the S&P −0.3%, the Russell −0.2%, the Dow −1.3%. On the year: Nasdaq 100 +22.4%, Russell 2000 +14.1%, S&P 500 +12.8%, Dow +6.5%. The Dow, with its banks, its health care and its industrials, had the worst week of the four; the Russell held its ground after a month in which it gave back most of its August lead.
The Treasury curve, one month to thirty years
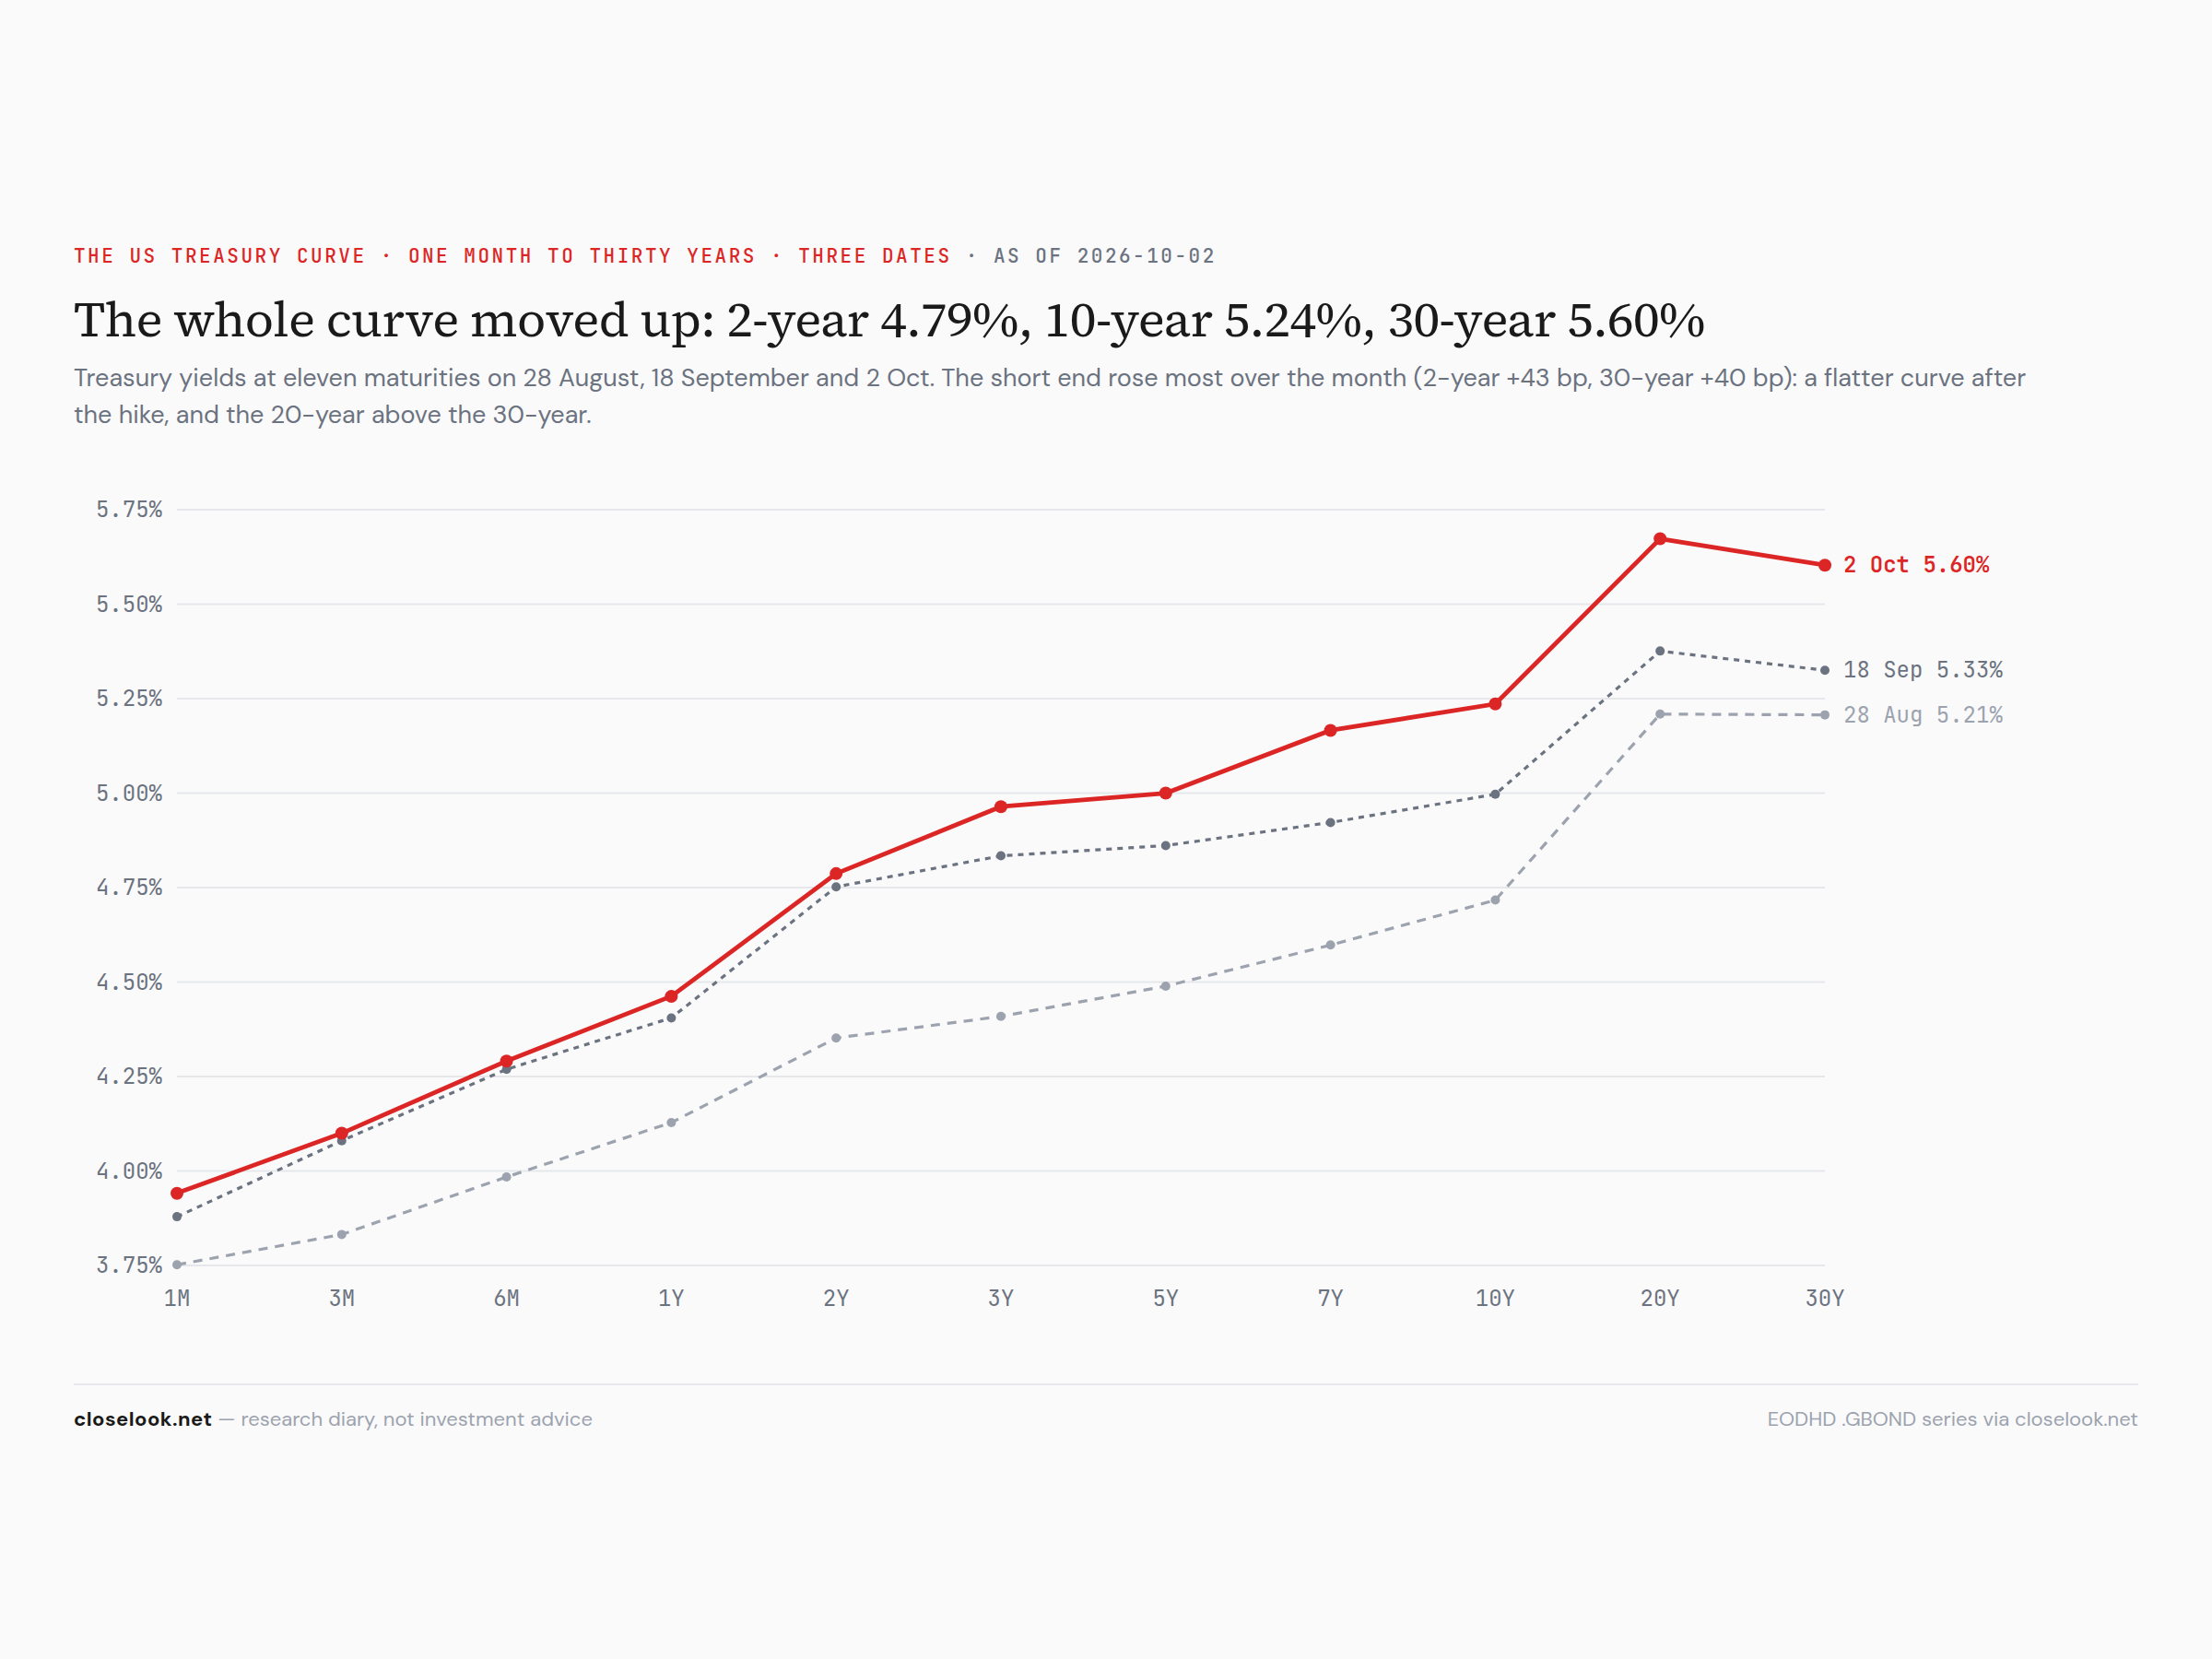
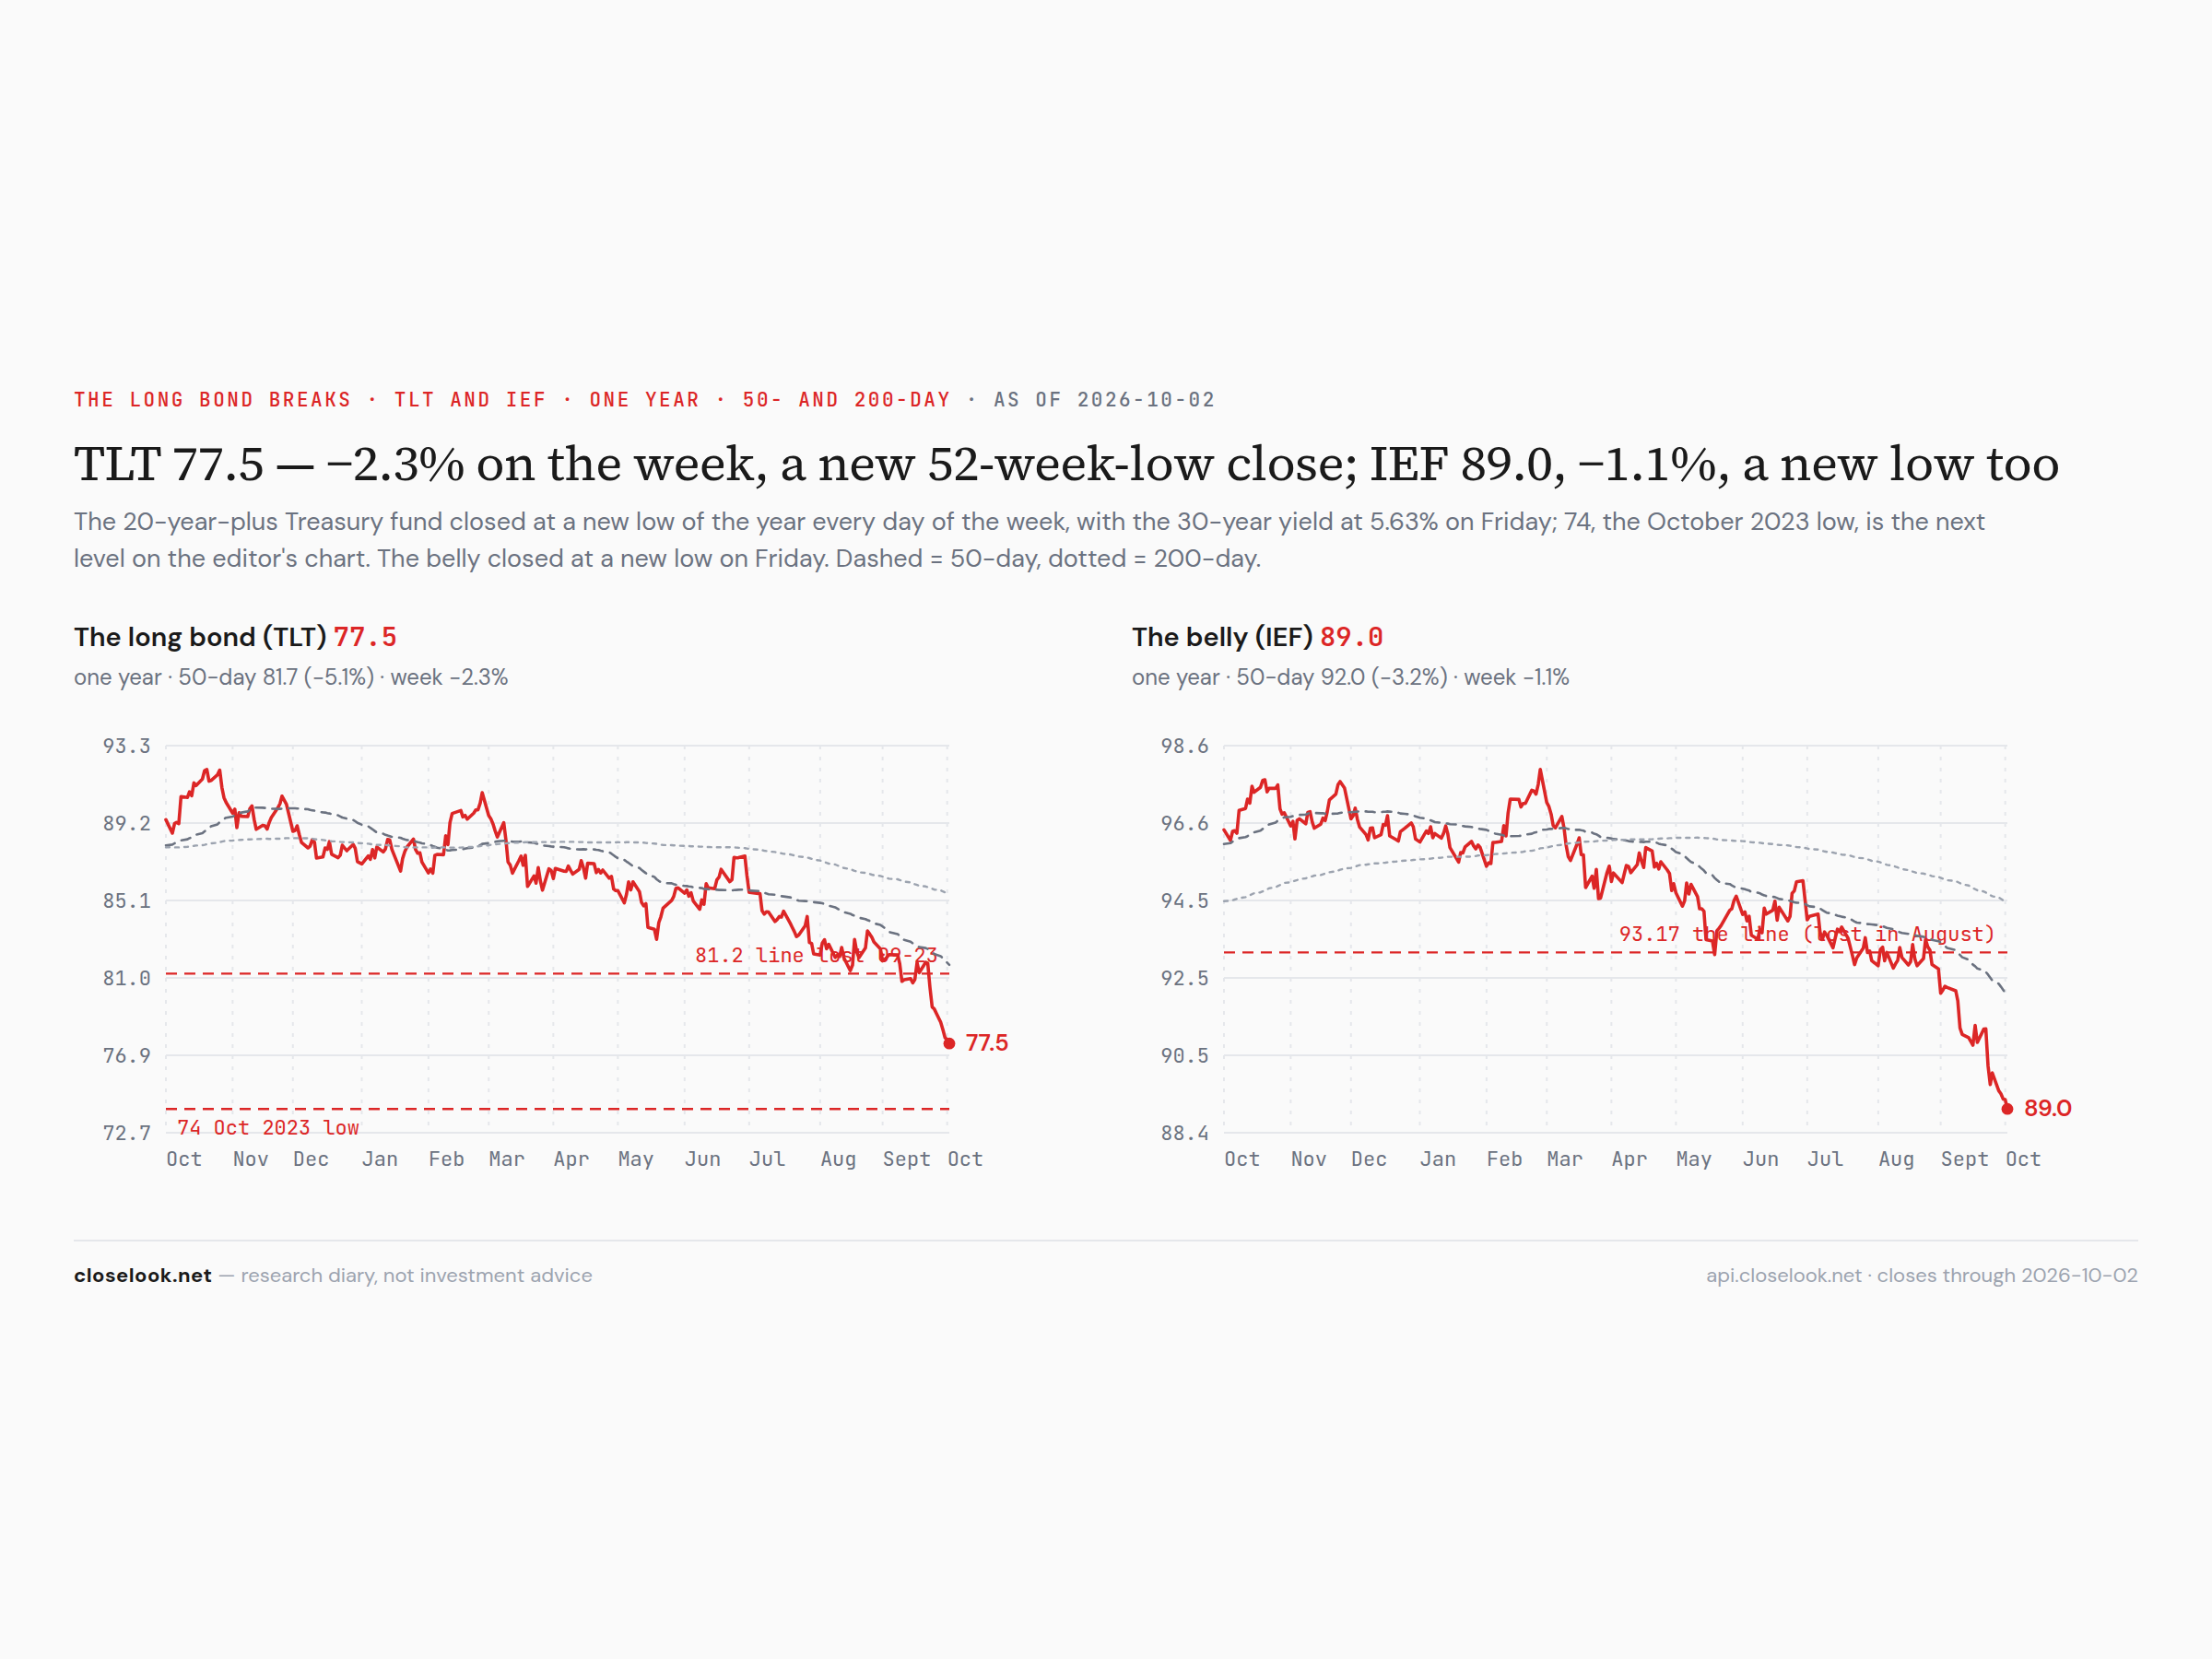
The whole curve moved up again: the 2-year 4.79%, the 10-year 5.24%, the 30-year 5.60% on the curve series. Over five weeks the 2-year rose 43 basis points and the 30-year 40; the 20-year sits above the 30-year. The week's bond fact is the one Saturday's Global letter set at the centre: core inflation came in at 0.2% for August (3.0% on the year, 3.3% expected) and September payrolls at 29,000 with 60,000 of revisions — and the long end still rose. The long-bond fund closed at a new low on every day of the week, 77.48 on Friday, 4.5% above 74, the October 2023 low; the belly closed at 89.05, a new low. A rate that does not fall on soft data is trading on supply and credit, not on the Fed.
The dollar
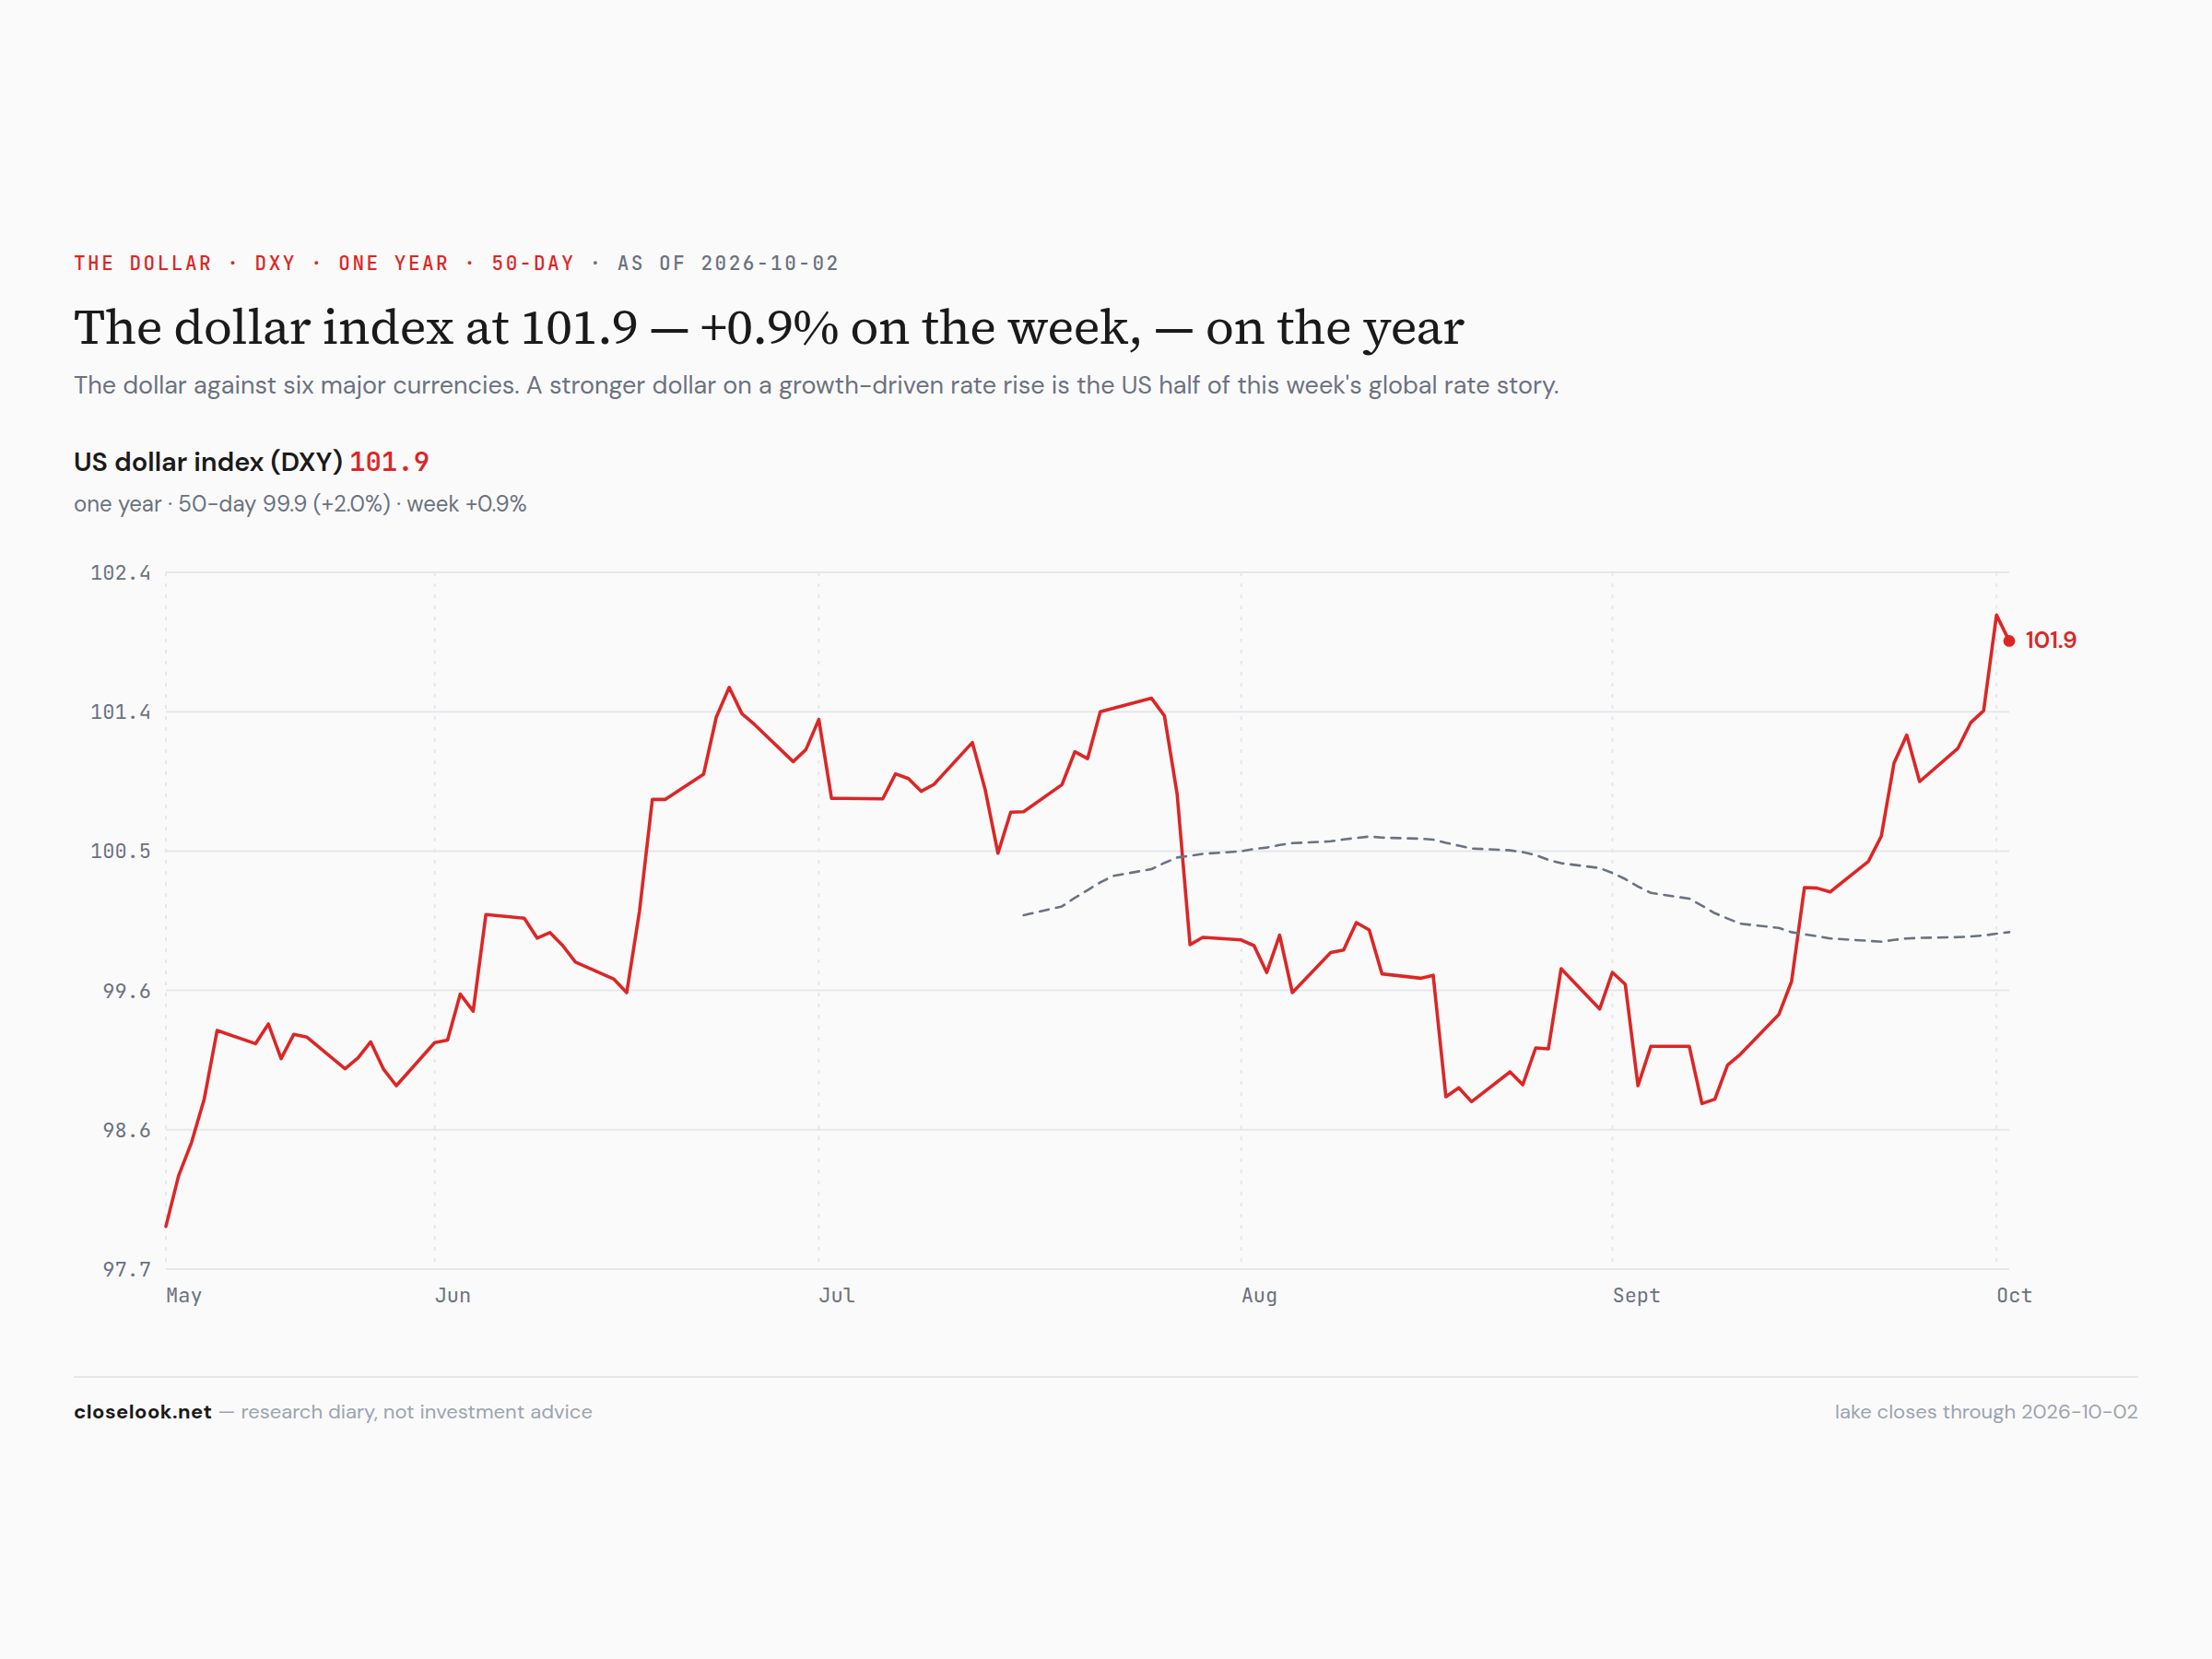
The dollar fund made its high of the year on Thursday. The fund closed 28.89, +0.94%, after 28.96 on Thursday — its highest close of 2026; the dollar index closed at 101.92. The euro fell to its lowest close of the year. A weak jobs report did not weaken the dollar: the market is ranking economies, and America's ranks first on growth. Saturday's Global letter has the geography.
2 · The State
The mechanism, named: a confirmation on a narrow base. Put the week in order. Monday: Seoul reopened lower with the memory makers; Meta started a unit to sell its AI stack to companies and hired MongoDB's chief executive, MongoDB −18%; Nvidia +2.7% in a red market; gold −3.8%; the Nasdaq 100 fund −1.07%. Tuesday: the 30-year touched 5.60%; the housing regulator opened mortgages to FICO's rival score, Fair Isaac −29%; the chips bounced. Wednesday: core inflation soft, the long bond lower anyway; oil fell on the strategic reserve; Jabil beat and raised and fell 7.7%; Micron's record quarter after the close. Thursday: Accenture +18% on record bookings, Synopsys +12.8%; the S&P +0.18% with the equal-weight fund ahead of it for a day; Nike missed on sales after the close. Friday: 29,000 jobs, a rally of 1.1% on the S&P and 1.8% on the Nasdaq at the open, half of it gone by midday, the 10-year higher by the close — and the Nasdaq 100 at a record on the close.
The confirmation is real by the rule this letter set: a weekly close above 746.16. What it confirms is the advance of the index, and the index this week was its technology. Technology was the only sector ahead of the S&P on the month; the equal-weight S&P is 3.2% under its 50-day average; the Nasdaq without tech is at its year low. That is not a contradiction. It is how a market led by one group looks at a record, and the house thesis says it is the ordinary shape: a small group carrying the aggregate, most members fading underneath. The question for the fourth quarter is not whether the group is narrow. It is whether the group's earnings keep coming in.
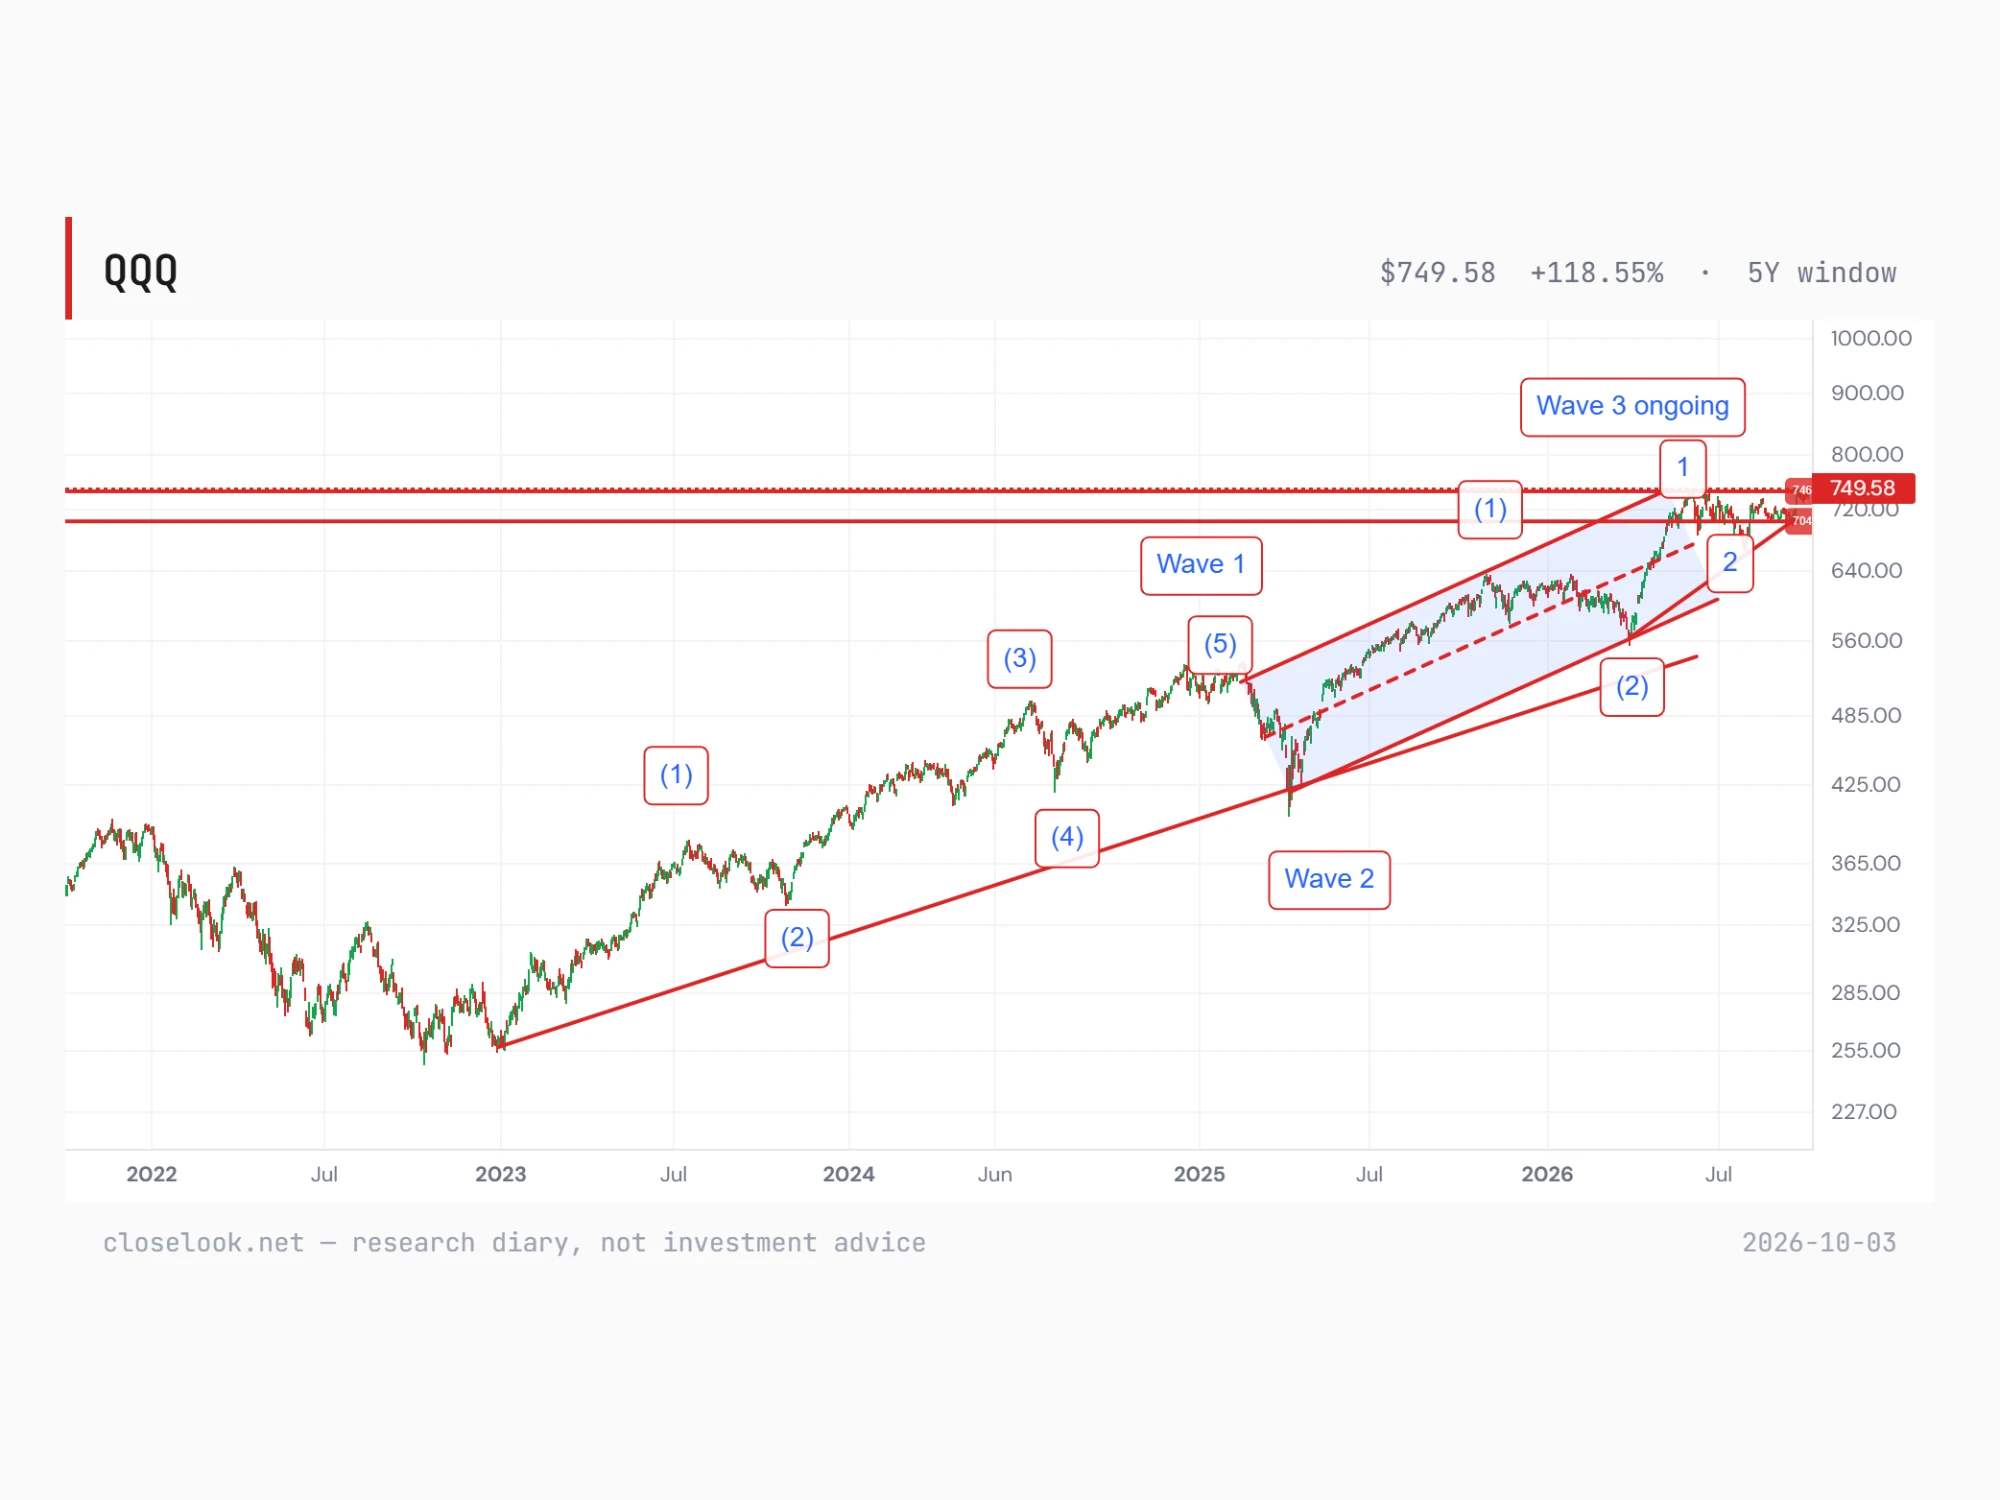
The count — the first weekly close above the top of wave 1. The editor's five-year chart carries the house wave count on the Nasdaq 100 fund. The advance from the 2022 low completed five waves into early 2025 — wave 1 of the larger count — and the April 2025 low was wave 2. Wave 3 is ongoing. Inside it, (1) and (2) are complete, the second at the April 2026 low; then 1 ran to the June high at 746 and 2 was the summer's pullback, which held the 704 shelf. Friday's 749.58 is the first weekly close above 746, the top of that wave 1. On the count, that is the reading this letter has carried since August as possible and unresolved: a third wave inside a third wave inside a third wave — the strongest stretch a count can describe. It is a count, not a forecast. It is falsified by a weekly close back under 704 and, decisively, under 694; it is confirmed by the quarter's closes holding above 746 while the earnings come in. Over the five years on the chart the fund is up 118.6%.
The chips on the desk's lines. Every chip wrapper closed above its 50-day average again: the chip index 11.2% above it, the chip majors 10.7%, the fabless fund 11.0%, the equal-weight semis 9.6%. None is at its high: the chip index 10.1% under its June 22 high, the chip majors 5.7% under, the fabless fund 4.6%, the equal-weight semis 14.4%. The equipment makers carried the week — Lam +10.2%, Applied Materials +11.4%, KLA +10.1%, ASM International +9.8% — on Micron's order book and Tokyo's equipment rally; the bellwethers: Nvidia +3.95% to 233.95, 0.8% under its May high; Broadcom +0.66%; Micron −0.68% after its record quarter; TSMC's ADR +4.92% to 472.78. Sunday evening's Hypergrowth letter has the names.
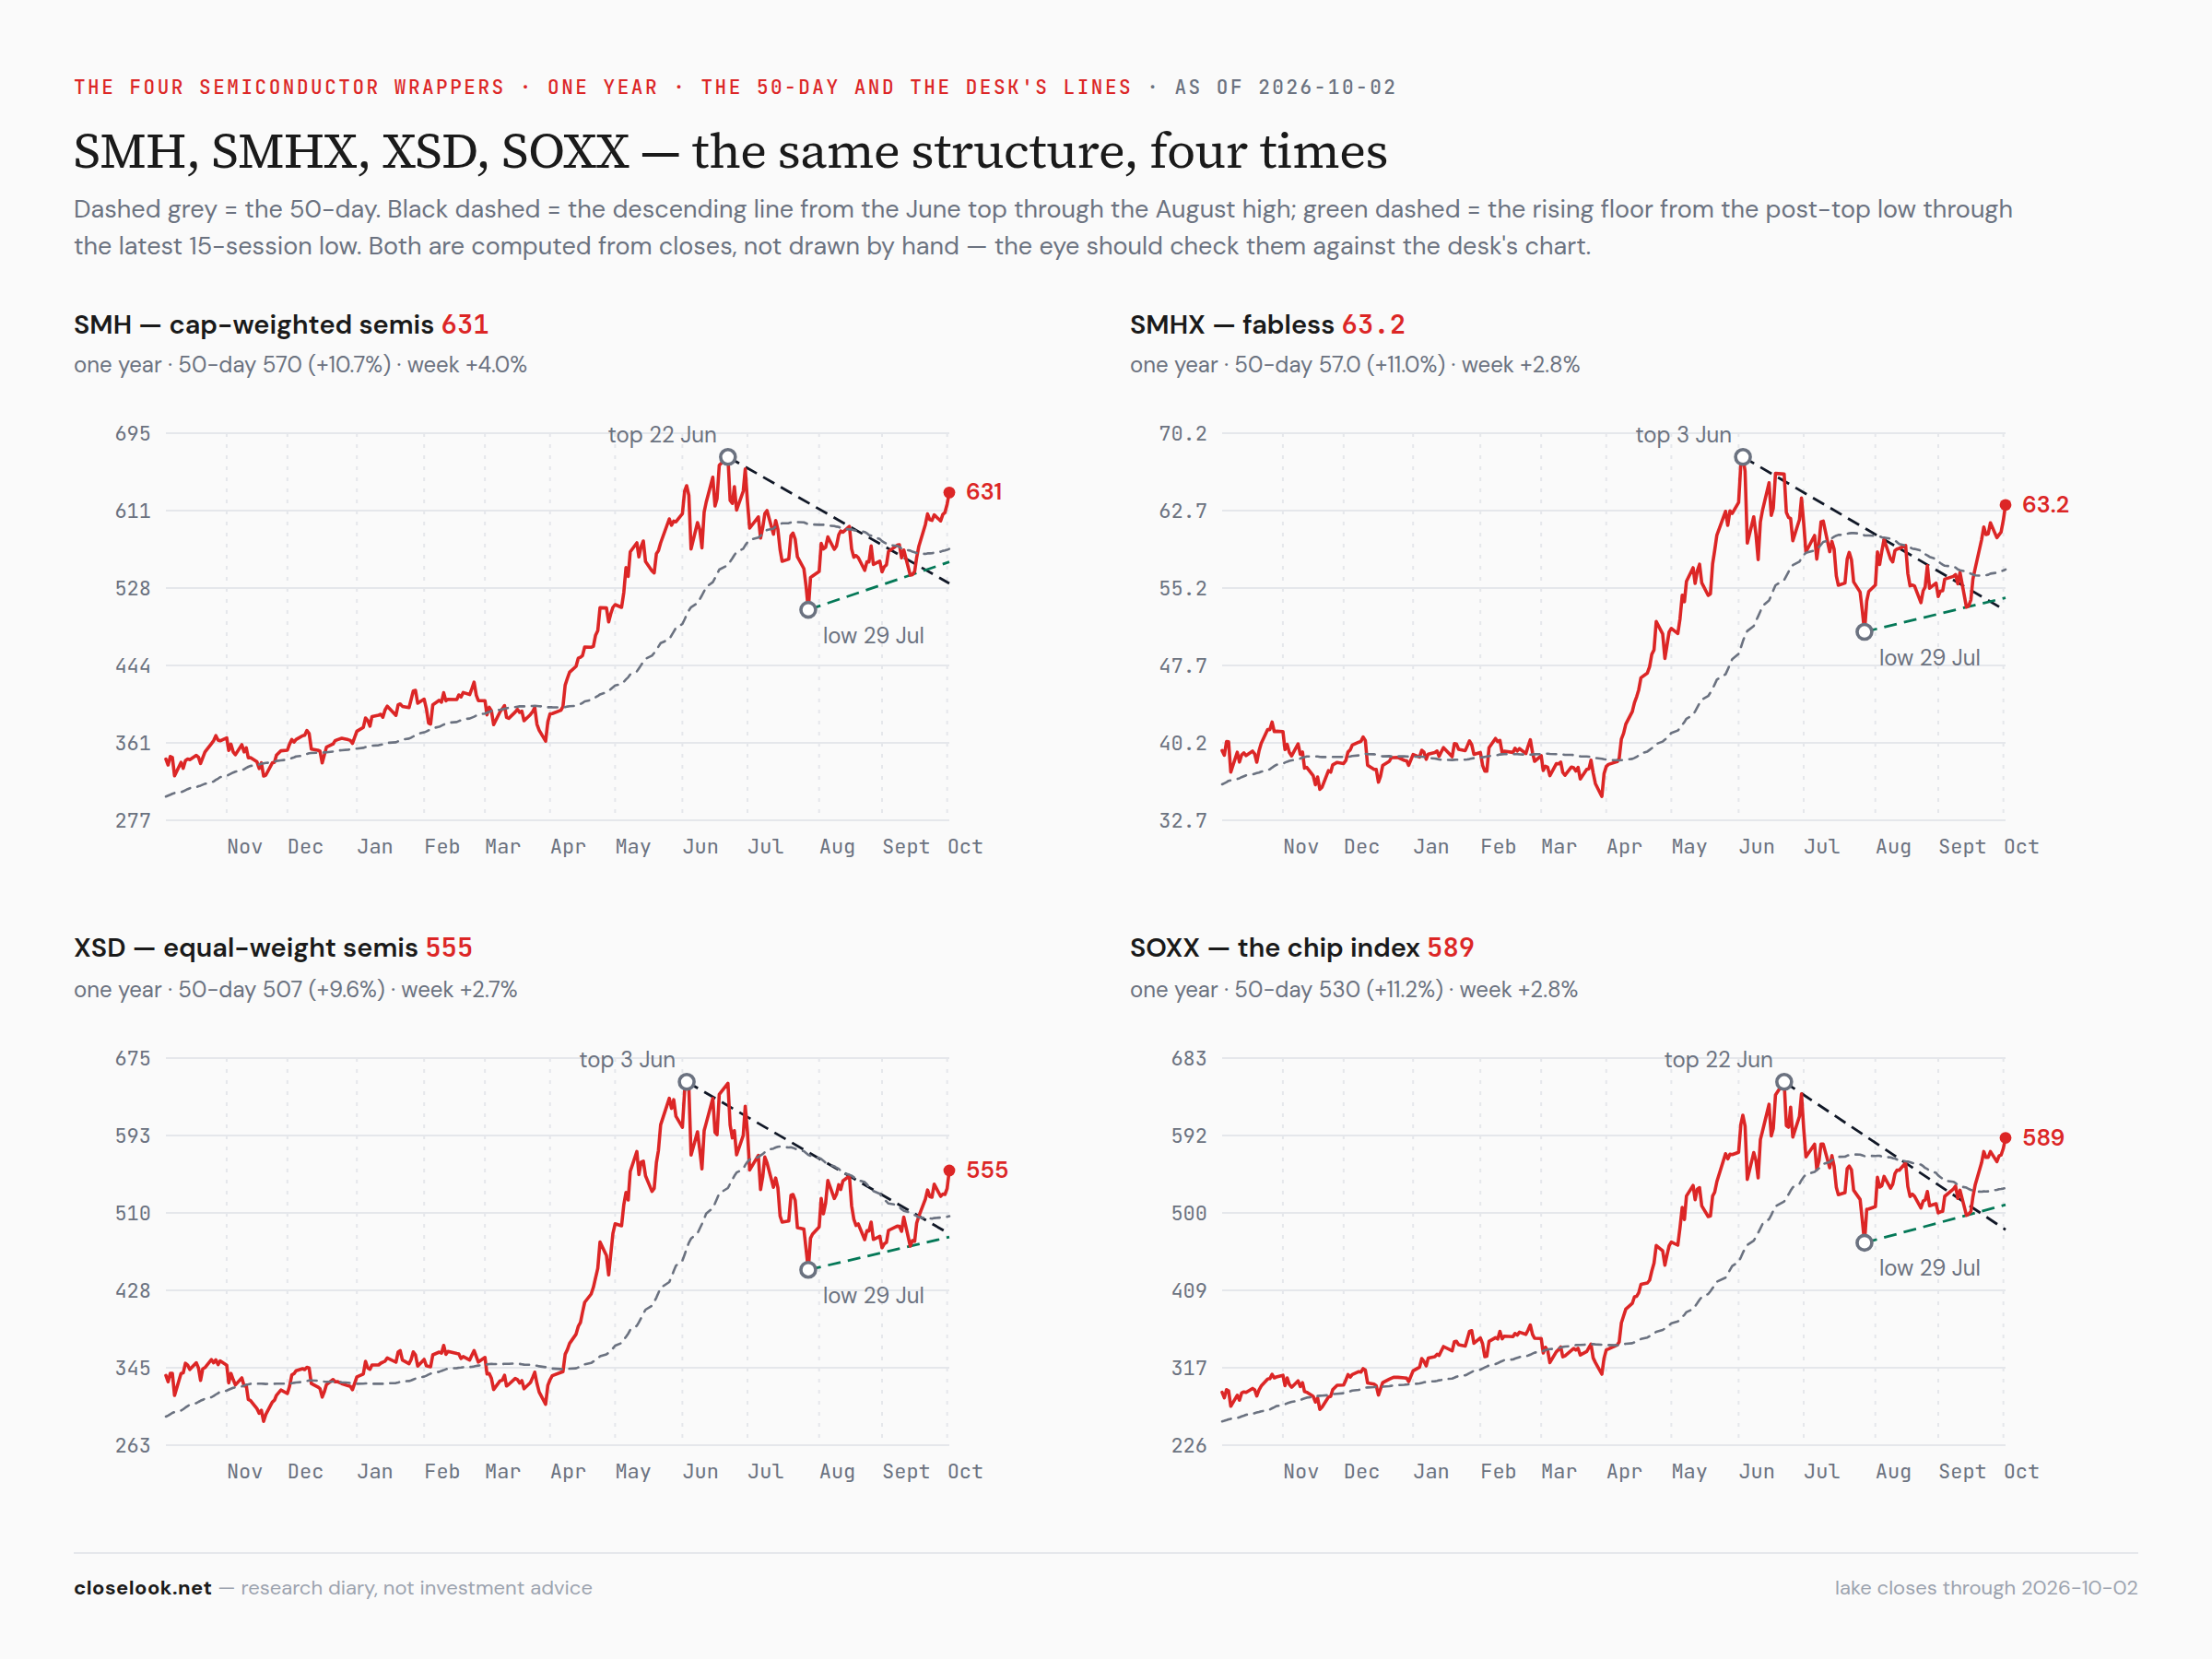
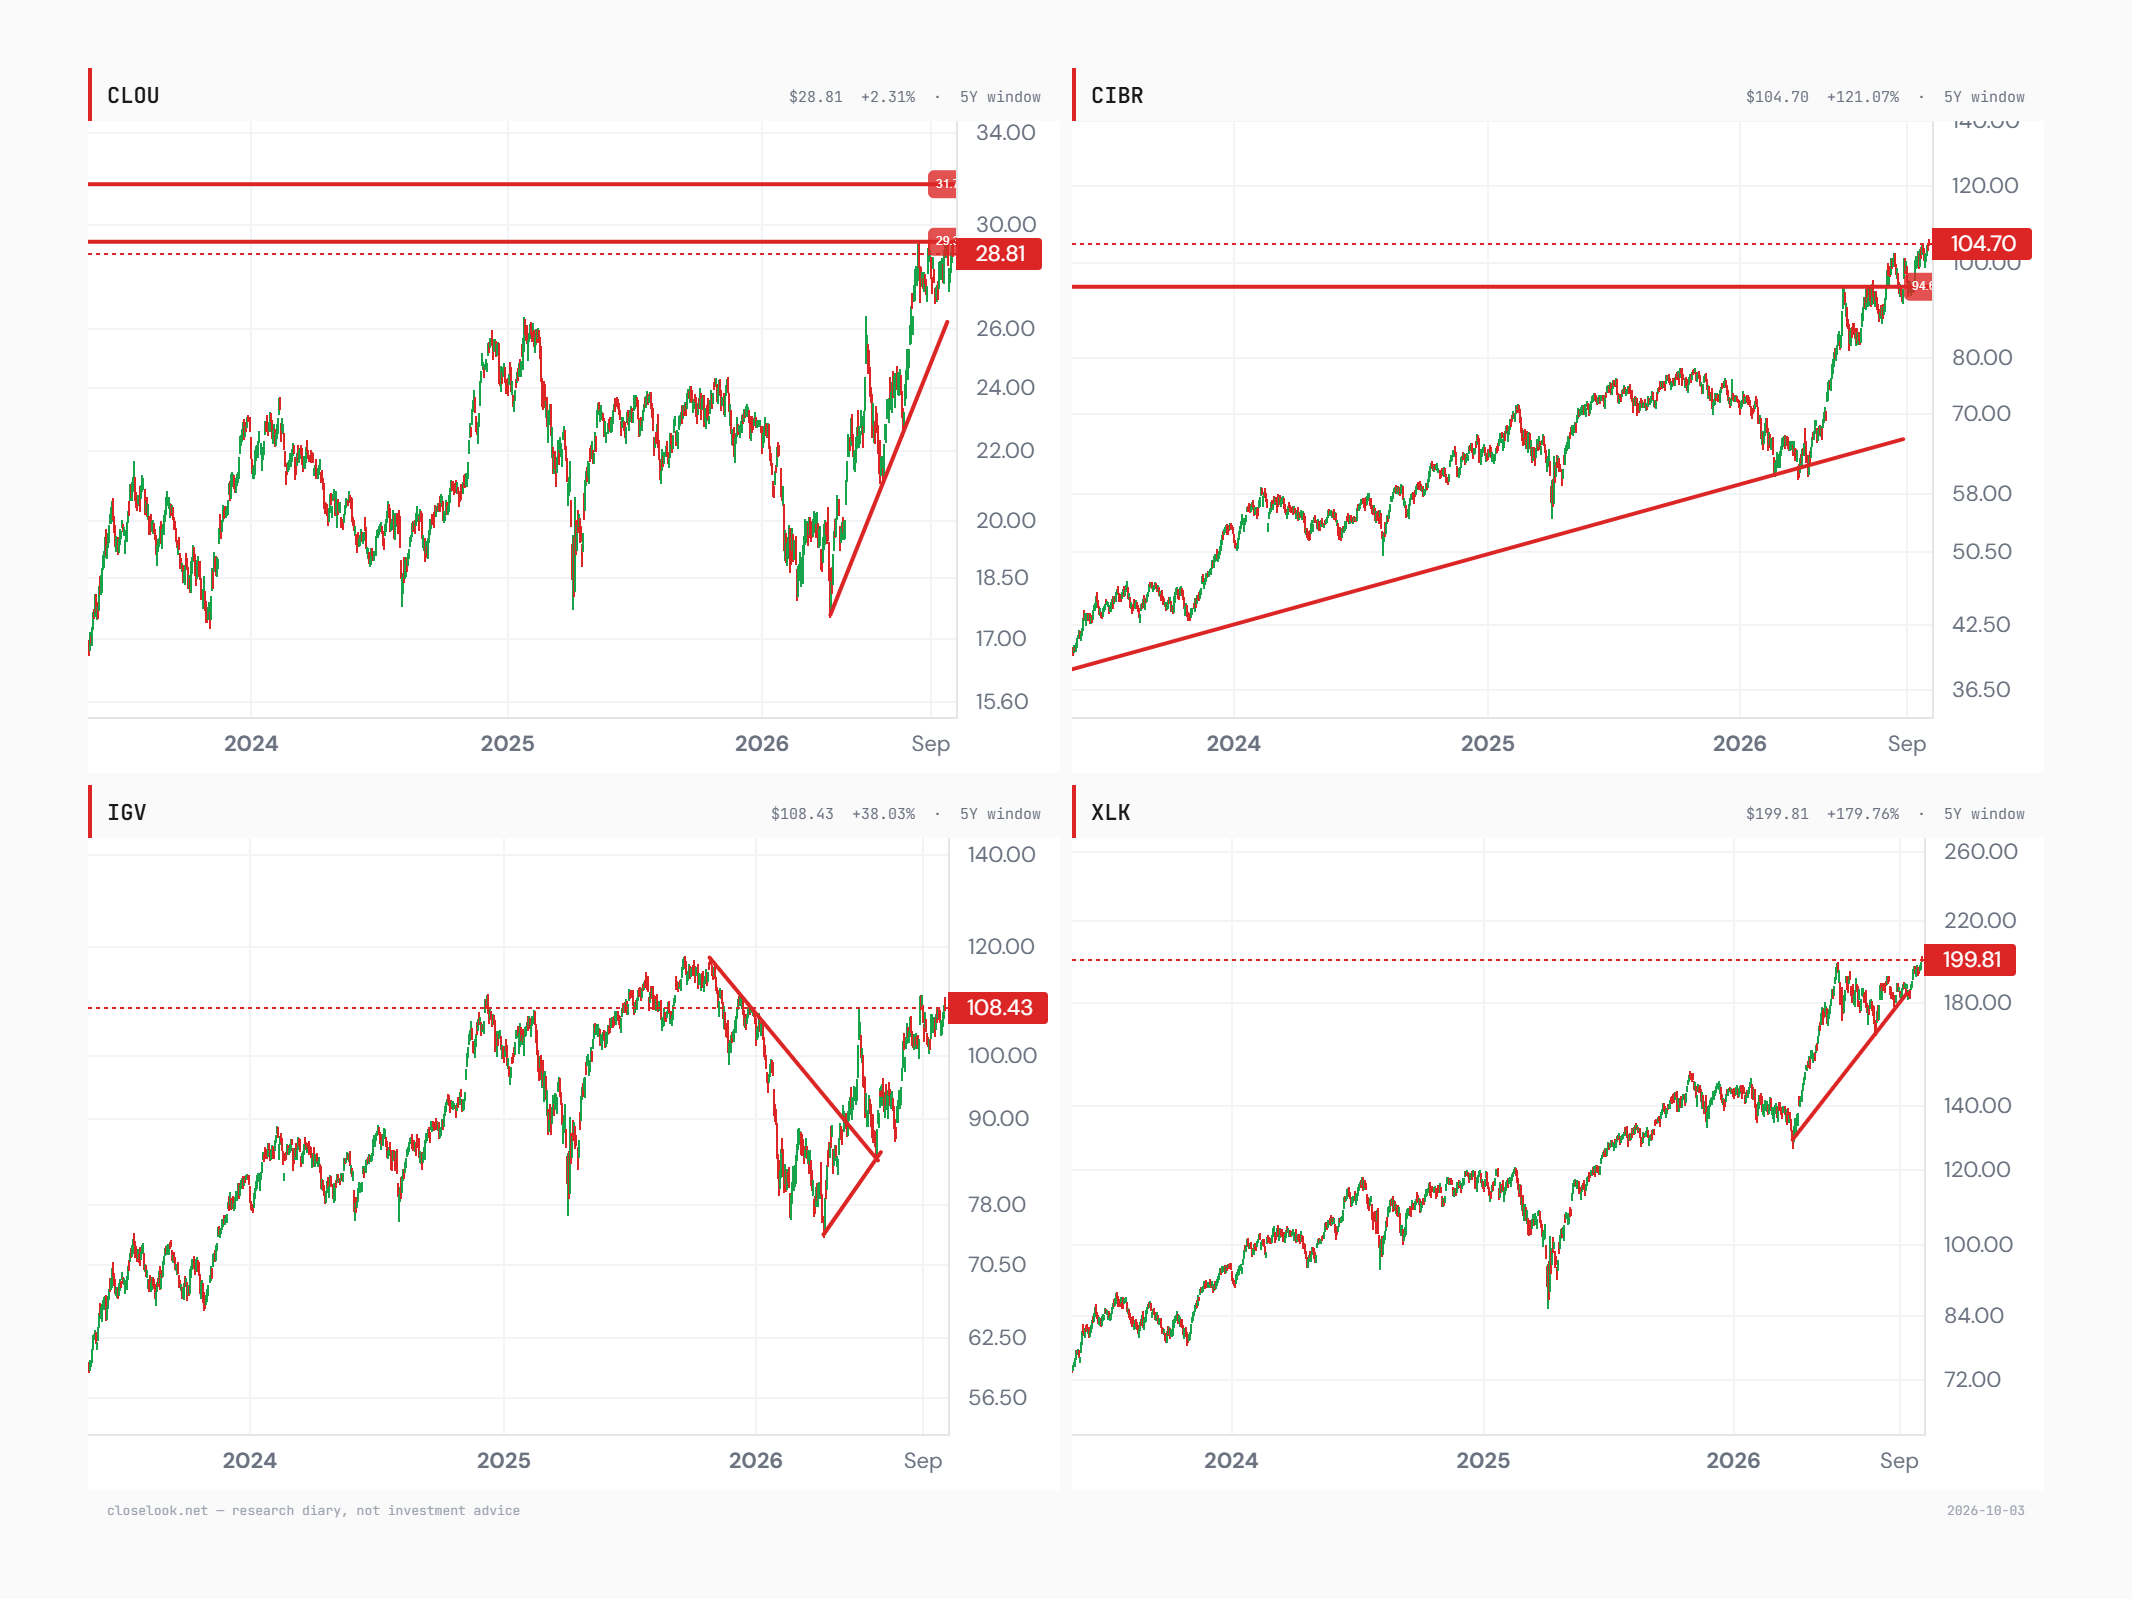
The tech sectors on the editor's lines — every bull trend intact. The chips: the chip index trades inside the rising channel it has followed since late 2025, back in its lower half after the summer's pullback, and the chip majors inside both the channel from 2024 and the steeper one from 2026, back above the 565 line they lost in the summer. The chip bull is intact on both drawings. Cloud is above the steep line from its April low and just under the 29.1 door, with 31.7 the next level. Cybersecurity holds above the rising line from 2023 and above 94, the level it broke out of. Software broke out of the falling wedge from its 2025 high. The US tech sector is at a record above the rising line from its April low. Against the non-tech half above, that is the week's picture in charts: the tech trends intact, the rest of the market on its last support.
The megacaps — the fund flat under its record. The Magnificent Seven fund closed 72.59, −0.07%, 0.5% under its September 21 record of 72.97. Inside: Nvidia +3.95%, Amazon +0.74%, Microsoft +0.26%, Alphabet −0.12%, Tesla −0.41%, Apple −2.16%, Meta −3.14% after its agent rally of two weeks ago. The megacaps did not lead this week; the chips under them did. The fund holds above 69, the top of the ten-month box it broke out of.
The print record — four windows open. The house Print Record grades a report by the stock's move over three sessions inside a ±3% band — "paid" above it, "sold" below it, "flat" inside. Four windows are open going into the week, and Friday's closes say where they stand, not how they end. Micron, from 1,065.11: 1,074.89, +0.9%, inside the band — the card that has never once been flat in ten prints sits flat with one session left; graded on Monday's close. Jabil, from 286.86 after its 7.7% fall on a beat: 304.41, +6.1%, above the paid line; graded on Monday. Accenture, from 212.30 after its 18% day: 198.90, −6.3%, under the 205.93 sold line; graded on Tuesday. Nike, from Friday's 33.87 after its sales miss; graded on Wednesday, paid above 34.89, sold under 32.85. Last week's verdicts: Cintas paid +4.5%, Costco paid +3.1%, BlackBerry flat.
3 · The Outlook
The house indices — the builder up 111% on the year. We read the three together because they are three stages of one spend. Capex (Rubin Build-Out) +5.87% to 2,172.09, +111.3% on the year, 103 of 126 members up on the week, a median member +5.45%. Opex (Agentic Ecosystem) +3.25% to a record 1,738.49, +76.2%. Applications (Agentic Winners 40) −1.06%, −8.1% on the year, 14 of 40 members up. HALO, the growth index with no AI thesis, fell 1.13% with 32 of 97 members up. The same split as the Nasdaq cuts, one level down: what builds and runs the AI economy rose; what sells on top of it and what has nothing to do with it fell.
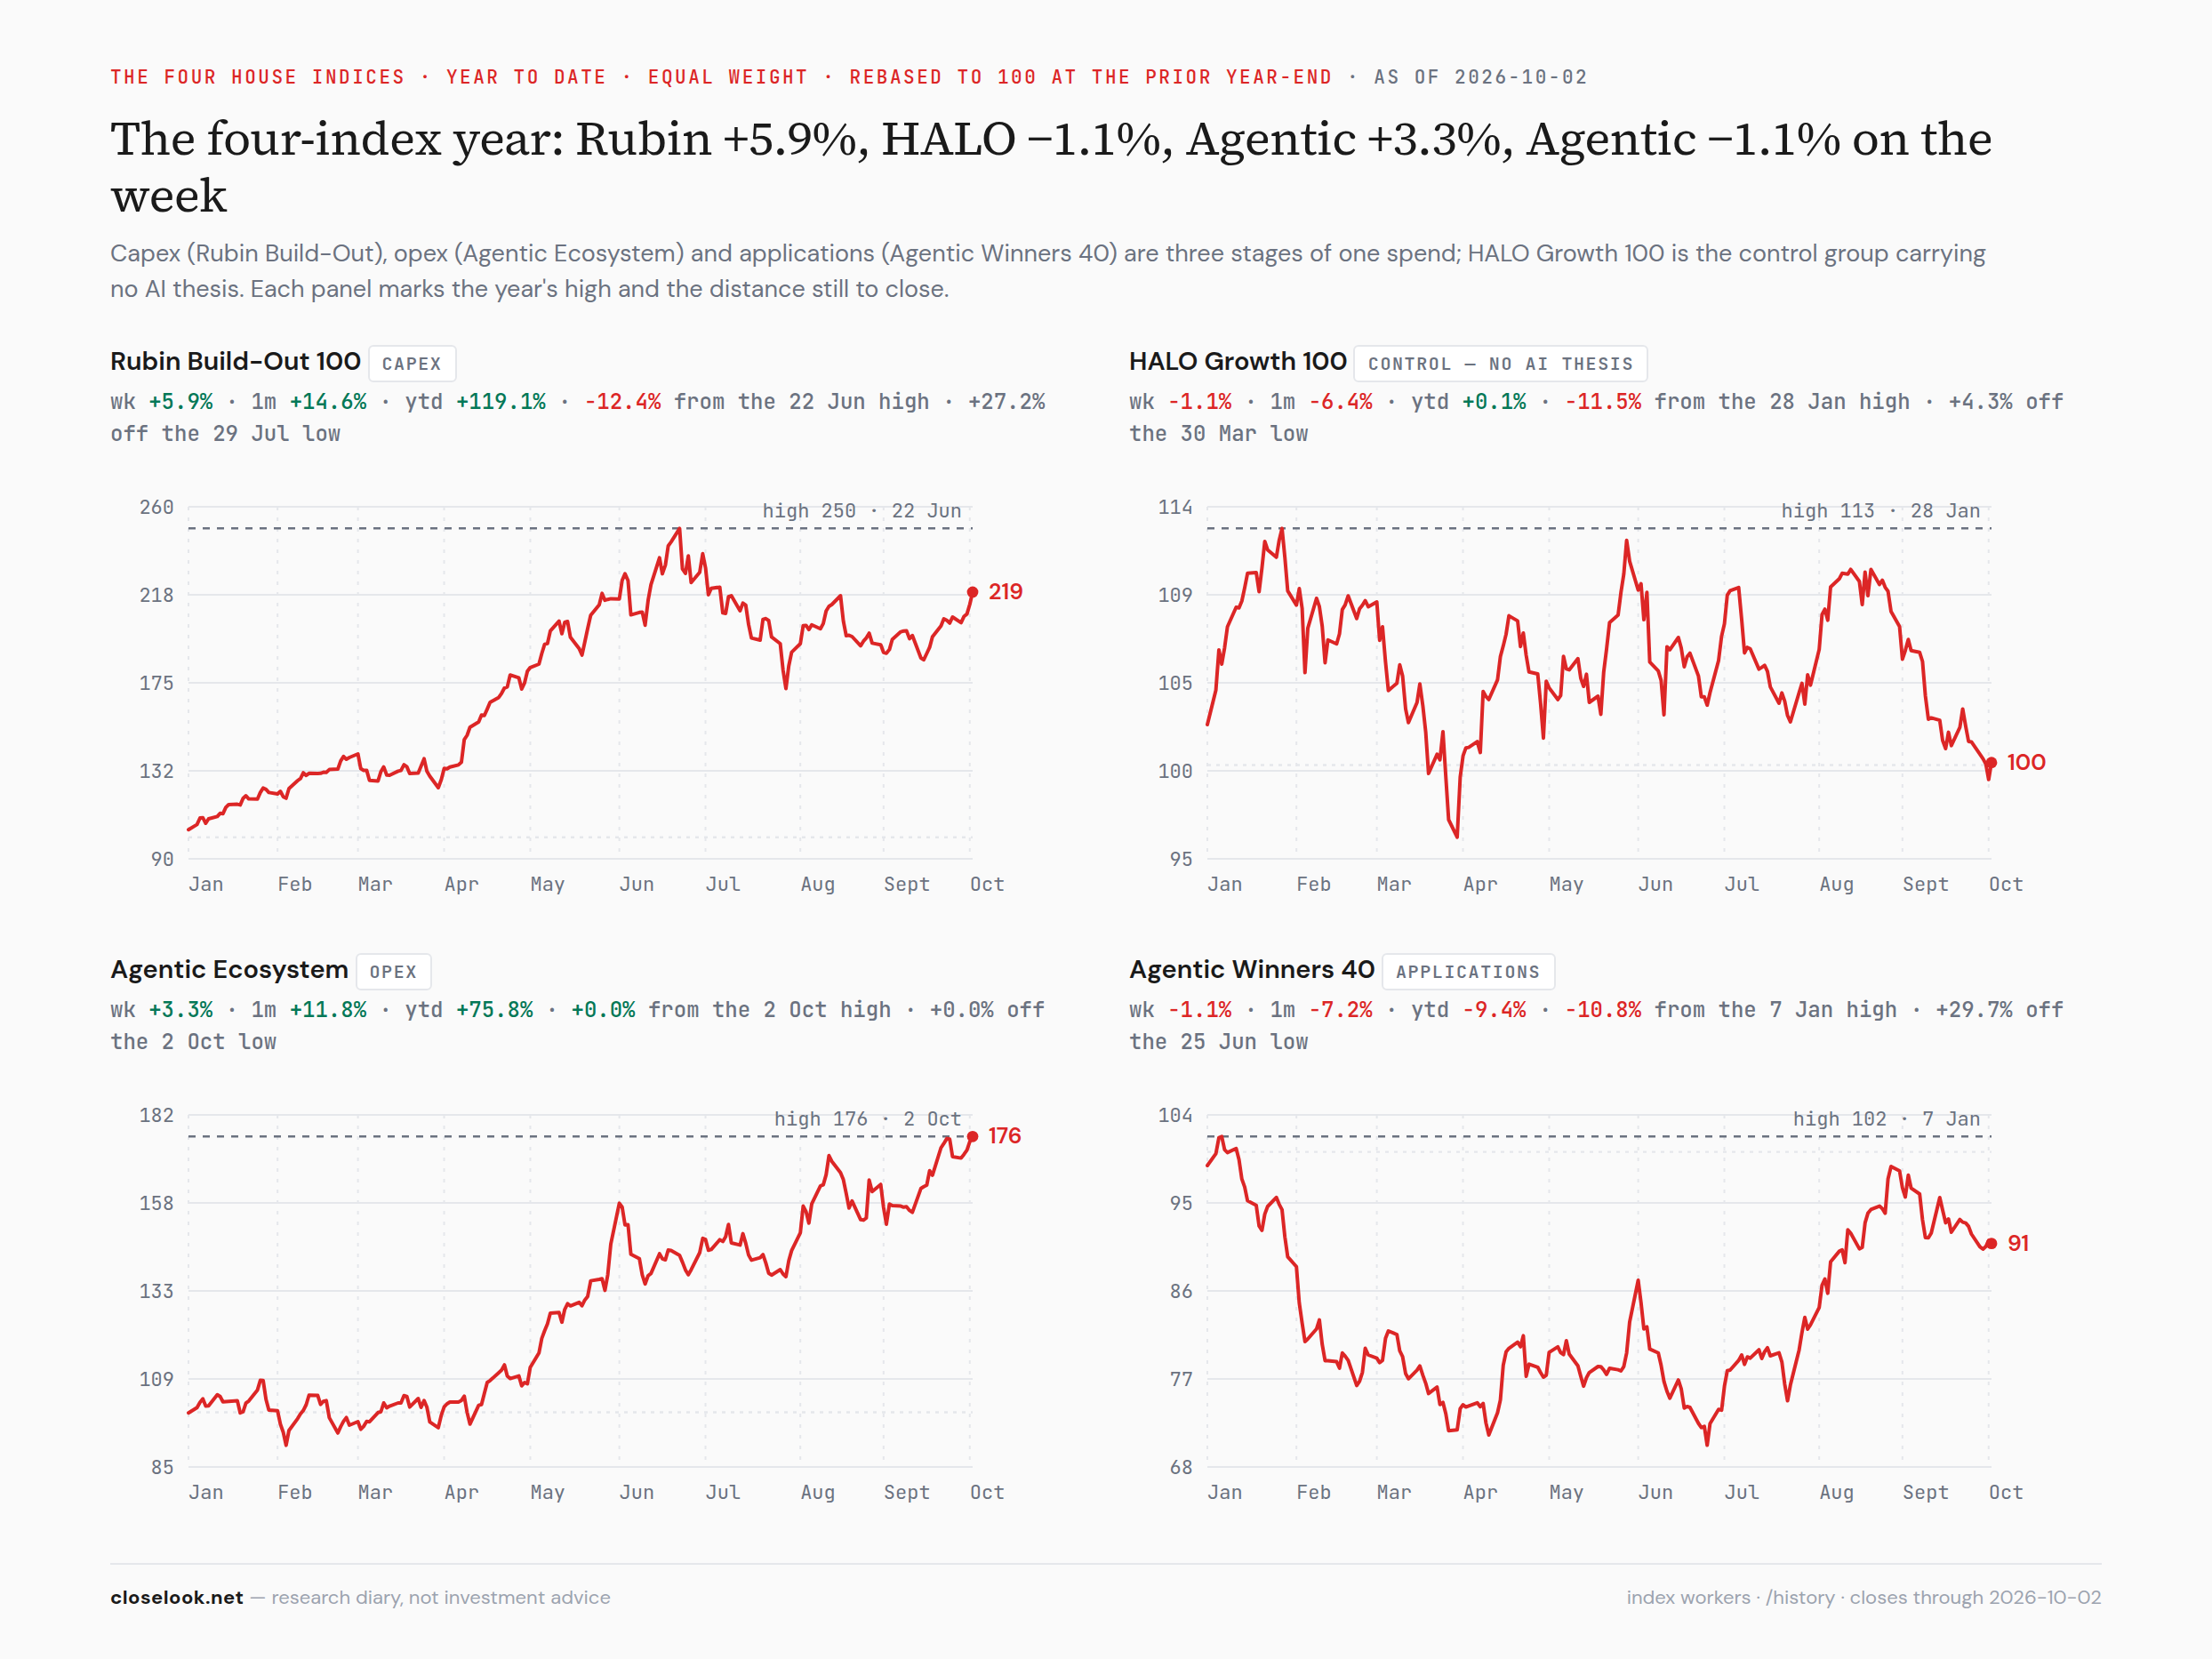
Inside the builder, the month. The best sub-indices over a month: testing and metrology +27.2%, substrates and interposers +24.5%, EDA and chip IP +20.1%, assembly and test +19.7%, high-speed interconnects +19.6%. The slowest: thermal management −0.4%, gases and chemicals +0.7%, photomasks +1.7%, wafer processing +3.4%, lithography +4.0%. The money is in the parts of the chain that test, package and connect the chips — the steps that decide how many good chips come out of each wafer.
The regime gauges. The Money Temperature composite closed at 57, from 62 — mixed, the middle of neutral, not a signal. The dollar 75, bitcoin 65, the Nasdaq 100 64, the S&P 60, the long bond 40, gold 37. The factor gauge reads momentum leading in the 99th percentile. Hot where the records are, cold where the rate is.
4 · What May Lie Ahead
The fourth quarter — positive for the US. This letter's frame for the rest of 2026, shared with Saturday's Global letter and stated so it can be scored: seasonally the fourth quarter is the strongest stretch of the US calendar, and it starts now; this letter expects it to be positive to year-end. The reason is the one the boards show every week: America is where the AI trade is listed — the platforms, the chip designers, the equipment makers — and the earnings of that group are what the index is pricing.
The next two weeks — uncertainty first, then the reports. The stretch to watch is the run-up to the reporting season in mid-October, with the midterm elections on November 3 behind it. The long bond is at its low, the dollar at its high, the market is carried by one sector, and the first big reports are still ahead. The stance for that stretch is to buy dips, not to chase. A pullback in the first half of October into the first reports is the ordinary shape of this calendar; it is the entry the season usually offers. Probability, not prophecy.
TSMC — the bellwether next week. TSMC publishes its September sales around 9–10 October; its third-quarter results are on the vendor calendar for 15 October, ASML's for 14 October. Every accelerator in the American AI trade passes through TSMC's fabs; its monthly sales are the build-out in one number, published before the American companies report theirs. A strong September carries the chips and the confirmation into the season. A soft one would be the first crack, and it would show in the chip funds first. This letter treats it as the week's signal.
The levels, updated. QQQ 749.58 — 746.16 confirmed on the weekly close and now the floor; 694 the kill-switch, 7.4% below; the 50-day at 716.82, 4.4% below. A weekly close back under 746.16 would make this week's confirmation a visit; a hold makes it the base of the quarter. SOXX 588.90 — 11.2% above its 50-day, 10.1% under the June 22 high of 655.01; 531 the first line under it. IGV 108.43 — a second weekly close above the 105.69 year-end line; 110.32, the August 27 high, 1.7% above. CLOU 28.81 — under the 29.11 door, 1.0% from it. MAGS 72.59 — 69 the support, 72.97 the record. QQXT 95.89 — a new low close for the year; the year's low is now the line, and a week back above 96.92, last Friday's close, would be the first sign of a turn. SPY 769.64 — 777.88 the August high, 1.1% above; the 50-day at 763.70 just under. TLT 77.48 — 74 below, 81.2 above; IEF 89.05 under 93.17.
The September frame — scored. Five weeks ago the letter set the base case: a consolidation of about five percent, anything better constructive. On the S&P the base case was not delivered — the index ended the month 2.0% under its August high on Wednesday's close and is 1.1% under it now; the Nasdaq 100 is at a record. Under the index it was delivered in full: the Dow ended September 6.3% under its August 5 high, the Russell 8.9% under its August 14 high, the Nasdaq without tech at its year low. The index measured the leaders; the leaders did not have an ordinary September.
The week's calendar. Monday: Micron and Jabil scored; mainland China shut for Golden Week. Tuesday: Accenture scored; Penguin Solutions reports. Wednesday: Nike scored. Thursday: PepsiCo reports. Thursday–Friday: TSMC's September sales; Delta reports on Friday. The week after: ASML on the 14th, TSMC on the 15th, and the reporting season.
5 · The AI Build-Out Portfolio
AI Buildout — 36 positions · unrealized +36.5% · benchmark Nasdaq-100 · snapshot Oct 6, 2026
| # | Symbol | Name | Weight | Unreal. |
|---|---|---|---|---|
| 1 | TOELY | — | 12.0% | +459.4% |
| 2 | NET | — | 3.9% | +81.3% |
| 3 | ATEYY | — | 3.7% | +43.2% |
| 4 | NVDA | — | 3.5% | +31.2% |
| 5 | TSM | — | 3.2% | +32.2% |
| 6 | CIBR | — | 3.1% | +21.5% |
| 7 | DDOG | — | 3.0% | +122.2% |
| 8 | NTRA | — | 2.9% | +94.3% |
| 9 | DOCN | — | 2.9% | -13.7% |
| 10 | SIEGY | — | 2.9% | -0.1% |
| 11 | PLTR | — | 2.8% | +34.0% |
| 12 | BB | — | 2.8% | -6.0% |
| 13 | ASX | — | 2.8% | +101.5% |
| 14 | AVGO | — | 2.8% | +16.2% |
| 15 | RBRK | — | 2.8% | +130.6% |
+ 21 more positions · full per-position cost basis & P&L is C+ subscriber-only.
What we did this week — one swap, one split. On Thursday the book sold its whole Western Digital line, 20.01 shares at 445.29, for 8,910.77 dollars and a gain of 3,280.99, and bought five SanDisk shares at 1,732.07, doubling that line to ten. On Friday Western Digital fell 10.2% to 415.29 on a report that Toshiba plans to double its hard-drive output for AI data centers — 6.7% under the sale. SanDisk closed at 1,719.99, 0.7% under the purchase. Tokyo Electron's five-for-one split arrived in the log on Friday: 100.27 ADRs became 501.36, at the same cost. Saturday's Pulse has the full ledger.
The book, marked — up about three and a half percent. The equity lines closed Friday at a market value of about $620,300 — +3.4%, or about +$20,500 on the week, by the engine mark (this week's units against Friday's and last Friday's closes). One correction to that mark: the portfolio tracker multiplied the Tokyo Electron ADR count by five but still quotes the ADR at its pre-split 164.55 dollars, which would put the line at $82,500. Priced from Tokyo — 12,100 yen, half a share per ADR, 157.9 yen to the dollar — the ADR is worth about 38.30 dollars and the line about $19,200, up about 7.7% on the week; that is the number used here. Net liquidation by the same mark is about $761,000 (last week's approximation plus the week's change; the weekly USD export will replace it), a headline return of about +52% on the $500,000 deposited.
What paid and what charged. Advantest +16.4% (+$3,407, the book's best), BlackBerry +13.3% (+$2,180), Coherent +13.9% (+$2,061), Infineon +12.1% (+$1,968), BE Semiconductor +8.0% (+$1,378), Tokyo Electron about +7.7% (about +$1,370, priced from Tokyo), Rubrik +8.2% (+$1,355), ASE +7.1% (+$1,266), Samsara +8.3% (+$1,264), TSMC +4.9% (+$1,000). The charges: Tempus −9.9% (−$1,676, the book's worst), Lenovo −7.9% (−$1,528), SanDisk −3.3% (−$578), Siemens −2.7% (−$547), and four small ones. Twenty-seven of thirty-five lines green. The equipment and packaging names the builder index rewarded paid the book; the applications charged it.
What we plan to do — nothing on Monday, and use the dips. The book sold a storage line and added to another inside the same theme; it is not for sale into a confirmed record. The plan for the stretch to the reporting season follows the frame above: add on weakness, not on strength, and act on the close, not on the day. The closes that matter are TSMC's sales week and the first two Fridays of the season.
The four tradable books, open for inspection. Alongside the reference portfolios on this site, the four Closelooknet-companion wikifolios — the tactical book, the AI-cycle thesis book, the ETF core, and the non-tech growth compounder — publish their own ledgers on the wikifolio platform, every transaction visible trade by trade, via Trade the Look. Same diary, harder currency. A research diary made investable for its author; not a recommendation.
6 · What May Go Wrong
One: TSMC disappoints. The confirmation stands on one group, and that group's supply chain reports first. A soft September from TSMC — or a cautious fourth-quarter word on the 15th — would hit the chip funds on the day, and with them the only sector carrying the index. The falsifier is the line above: QQQ back under 746.16 on a weekly close.
Two: the long end wins against the earnings. A long bond that falls on soft inflation and a weak jobs report is trading on supply. So far the companies with growth have absorbed it. If the 30-year moves toward 6% while the economy slows — the 29,000 jobs are the first hint — the discount rate starts to win, and the records are where the selling would begin. A week in which the Nasdaq 100 falls and the long bond makes another low is that week.
Three: the narrow base gives way. The Nasdaq without tech at its year low, financials with no member above its 20-day average, the equal-weight S&P under its 50-day: a market this narrow can run further than anyone expects, and it can also turn in a session when the one group stumbles. The equal-weight S&P is the number to watch; a second leg lower there in a week the Nasdaq rises would say the base is shrinking, not rotating.
Four: the jobs report was a turn, not a blip. Twenty-nine thousand jobs with sixty thousand of revisions is a weak report. One weak report is noise; two in a row change the growth case that has carried the dollar and the yields — and with it the case for owning America over the rest of the world. October's report is the check.
Five: the dollar turns. The dollar at its high has made America the obvious place to own. A dollar that rolls over — on weak data or on policy — would hand some of the year back to the rest of the world quickly. The dollar fund back under its 50-day average on a weekly close is the first sign.
7 · Knowledge Corner
How an index makes a record while most of its stocks fall. An index like the Nasdaq 100 or the S&P 500 weights its members by their market value. The largest companies count for much more than the smallest: in the Nasdaq 100, the top thirty carry most of the weight. So the index can rise while most of its members fall, as long as the few large ones rise enough. This week the Nasdaq 100 rose 1.0% to a record while its non-tech members fell 1.1% to their low of the year and its seventy smaller members fell 0.3% — the tech half and the top thirty did all the work. The equal-weight version of an index gives every member the same weight, so it shows what the average stock did: the equal-weight S&P fell 0.65% in the week the Nasdaq made its record. Neither number is the "true" market; they answer different questions. The cap-weighted index says how the money invested in the market did, because that is where most of the money sits. The equal-weight index says how the typical company did. When the two agree, a rally is broad; when they split, as now, the rally is a few companies' earnings, and its fate is tied to those earnings. That is why the reporting season matters more to this record than to most: the index has already told you whose numbers it is waiting for.
8 · Final Words
The confirmation came. The Nasdaq 100 fund closed the week at a record, above the line this letter has waited on since August, and the index itself closed at its highest level ever. The chips rose for a second week, the equipment makers led them, software held its year-end line, and the tech sector made a record of its own.
The market underneath made its low. The Nasdaq without its tech stocks closed at the bottom of its year, the S&P without tech fell one and a half percent, only three sectors rose, and not one bank, insurer or broker in the S&P closed above its 20-day average. Soft inflation and a weak jobs report could not lower the long end; the long bond made a new low every day and the dollar made its high of the year.
Both are true, and the house thesis has a name for it: a small group carrying the aggregate while most of the market fades. The fourth quarter starts here — the strongest stretch of the calendar, with two uncertain weeks before the reports. This letter expects it to be positive for America, and it would buy the dips those two weeks offer rather than chase the record.
Price is the only truth. This week it said: the leaders are confirmed. TSMC's September sales, the scores for Micron, Jabil, Accenture and Nike, and the weekly closes — 746.16 on the Nasdaq fund, 105.69 on software, 74 on the long bond, the equal-weight S&P against its 50-day — will say whether the leaders have company in the fourth quarter.